Searching Logs
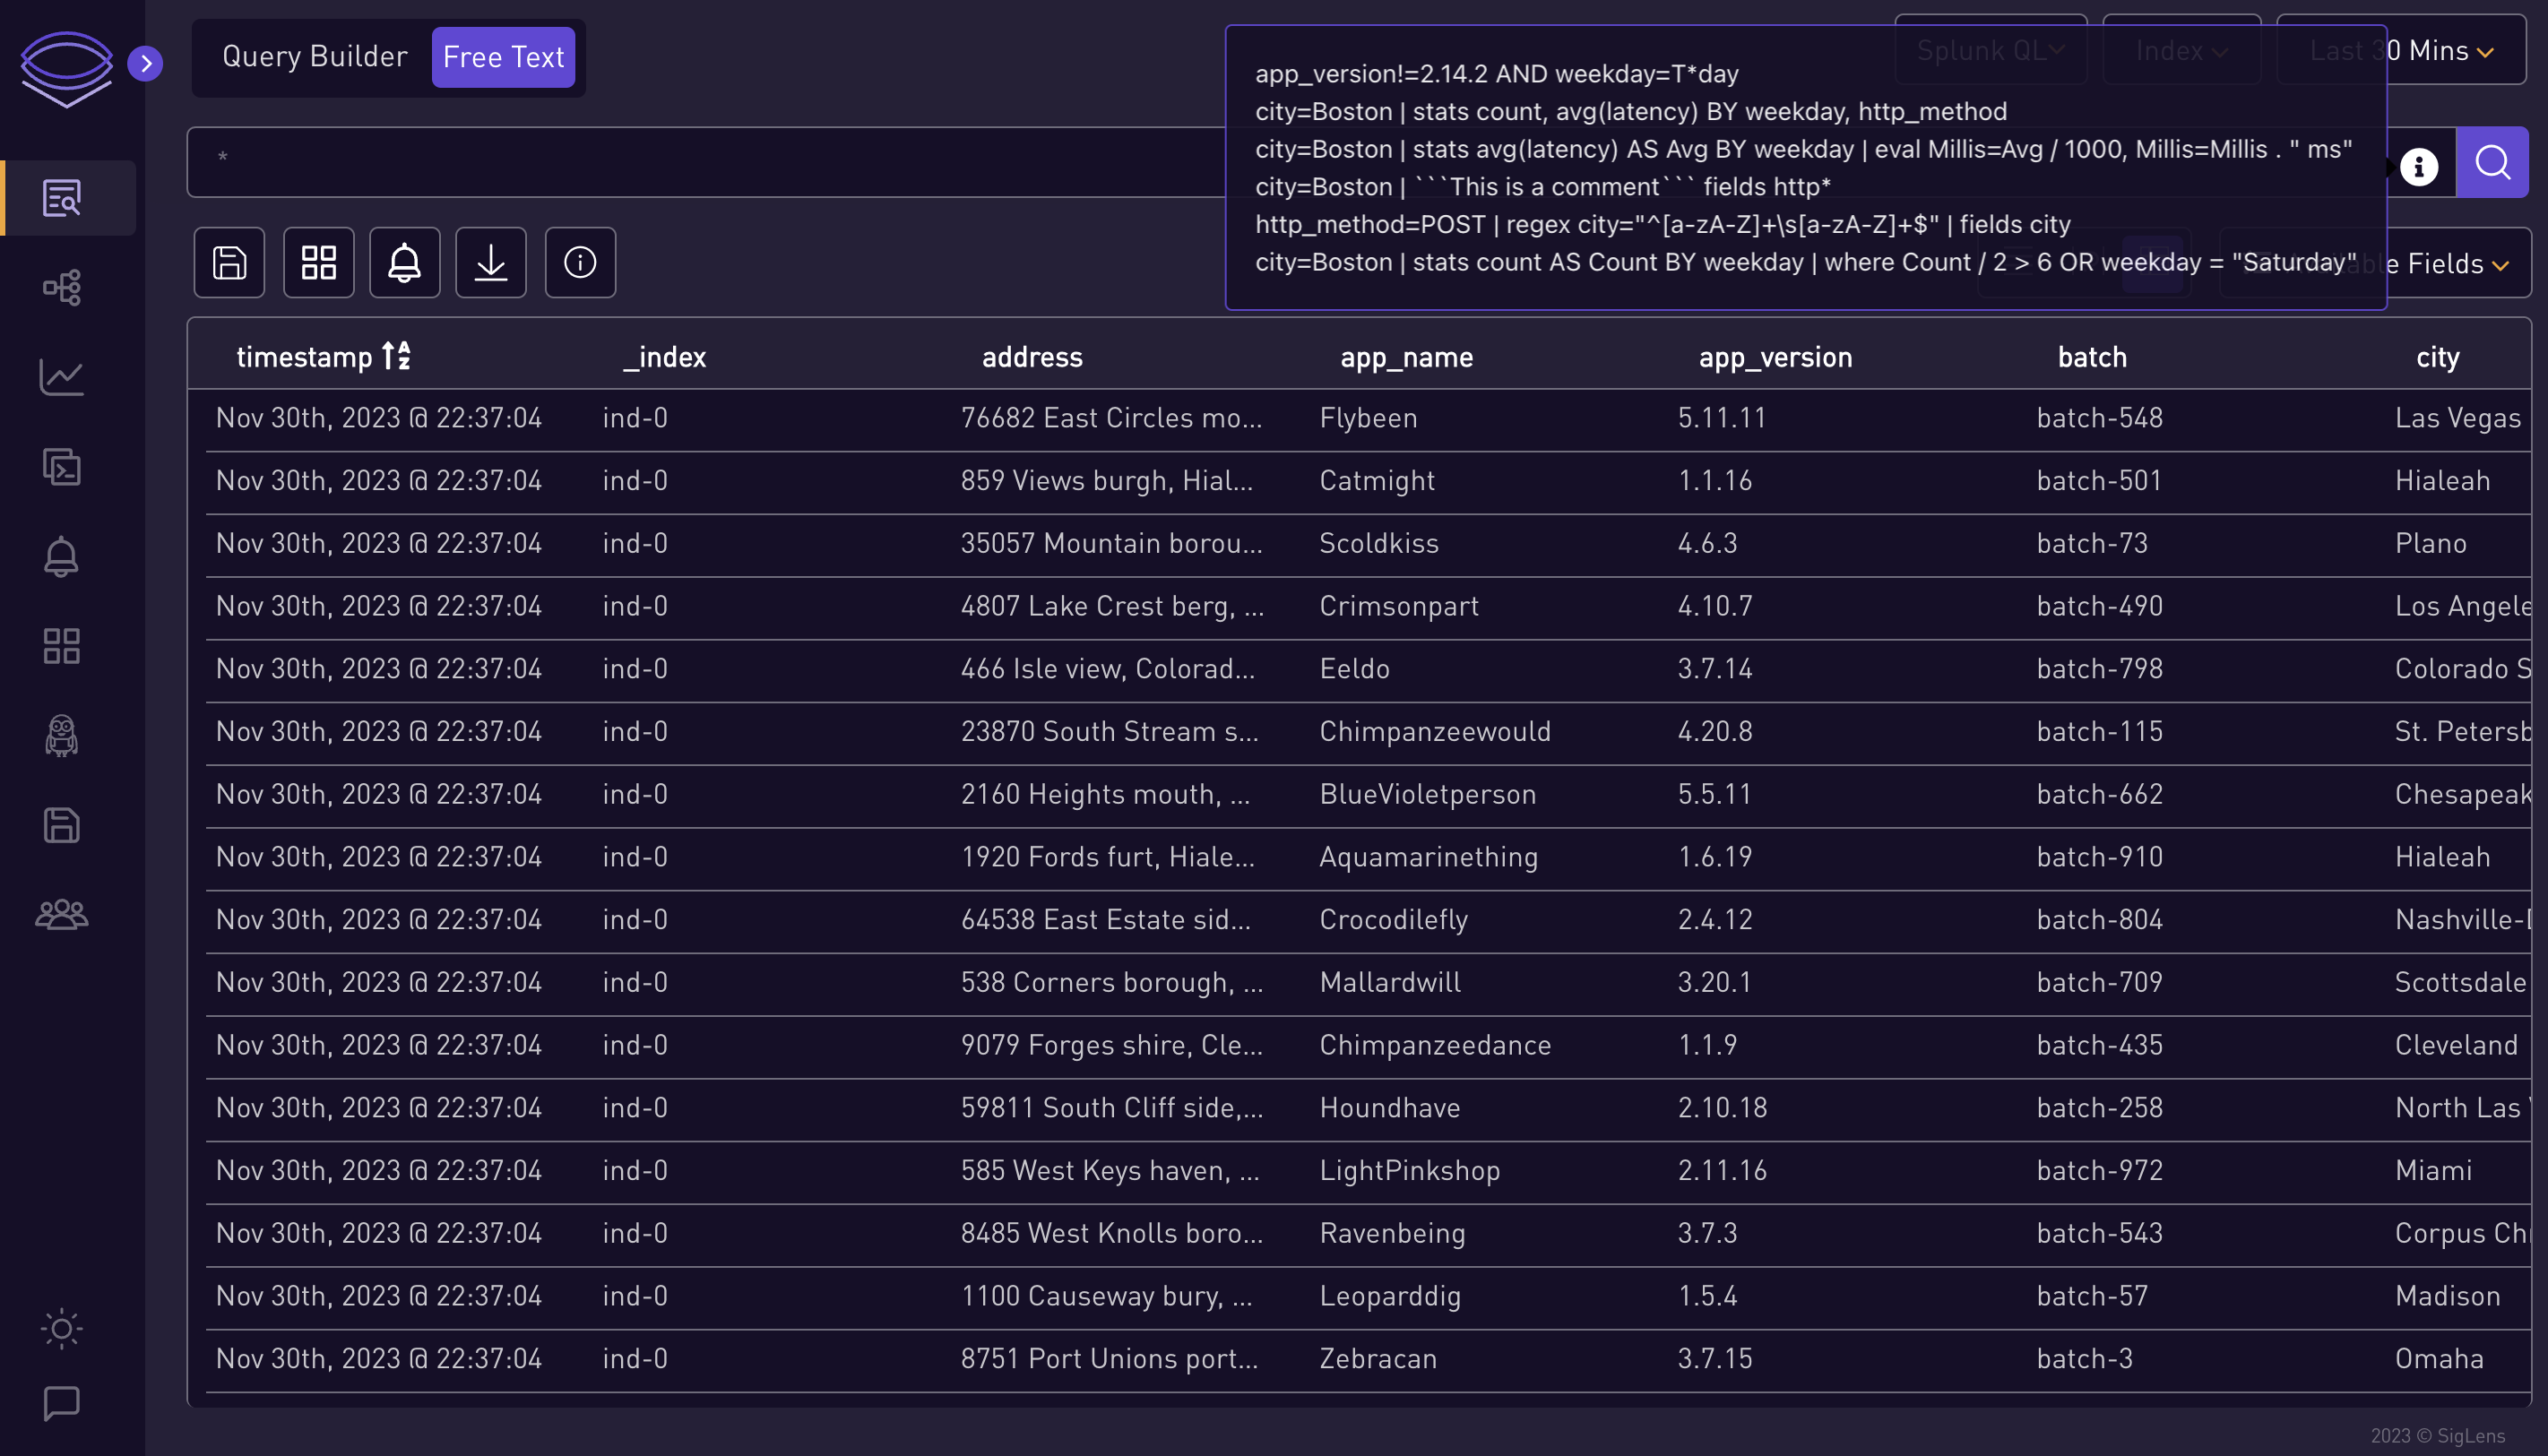
🔍 Log Search Interface Overview :
Supported Splunk - SPL Commands
Our system supports the following SPL (Search Processing Language) commands:
- Search: Searches for events that match the specified criteria. Read more.
- Regex: Matches events with a regular expression. Read more.
- Dedup: Removes duplicate events that share common values. Read more.
- Transaction: Groups events that are related to the same transaction. Read more.
- Stats: Computes summary statistics for your events. Read more.
- Timechart: Creates time-based charts from your events. Read more.
- Eval: Evaluates expressions and adds the result to your events. Read more.
- Rex: Extracts fields using regular expression named groups. Read more.
- Sort: Sorts events based on specified fields. Read more.
- Head: Returns the first N events from your search results. Read more.
- Fields: Selects which fields to keep or remove from your events. Read more.
- Top: Returns the most frequent values of a field. Read more.
- Rare: Returns the least frequent values of a field. Read more.
- Rename: Renames fields in your events. Read more.
- Where: Filters events based on a specified condition. Read more.
- Tail: Returns the last N events from your search results. Read more.
- Makemv: Converts a field with delimiters into a multi-value field. Read more.
- Format: Formats field values according to specified templates. Read more.
- Streamstats: Computes running statistics on your events. Read more.
- Bin: Groups numeric values into bins or ranges. Read more.
- Fillnull: Replaces null values with specified values. Read more.
- Mvexpand: Expands multi-value fields into separate events. Read more.
- Gentimes: Generates events for specified time ranges. Read more.
- Inputlookup: Retrieves data from lookup tables. Read more.
For detailed usage and examples, please refer to the specific command documentation.
⭐ Steps for Using the Logs Search ⭐
-
Select or Enter Queries:
-
You can either select a query from the info icon or enter your own.
-
-
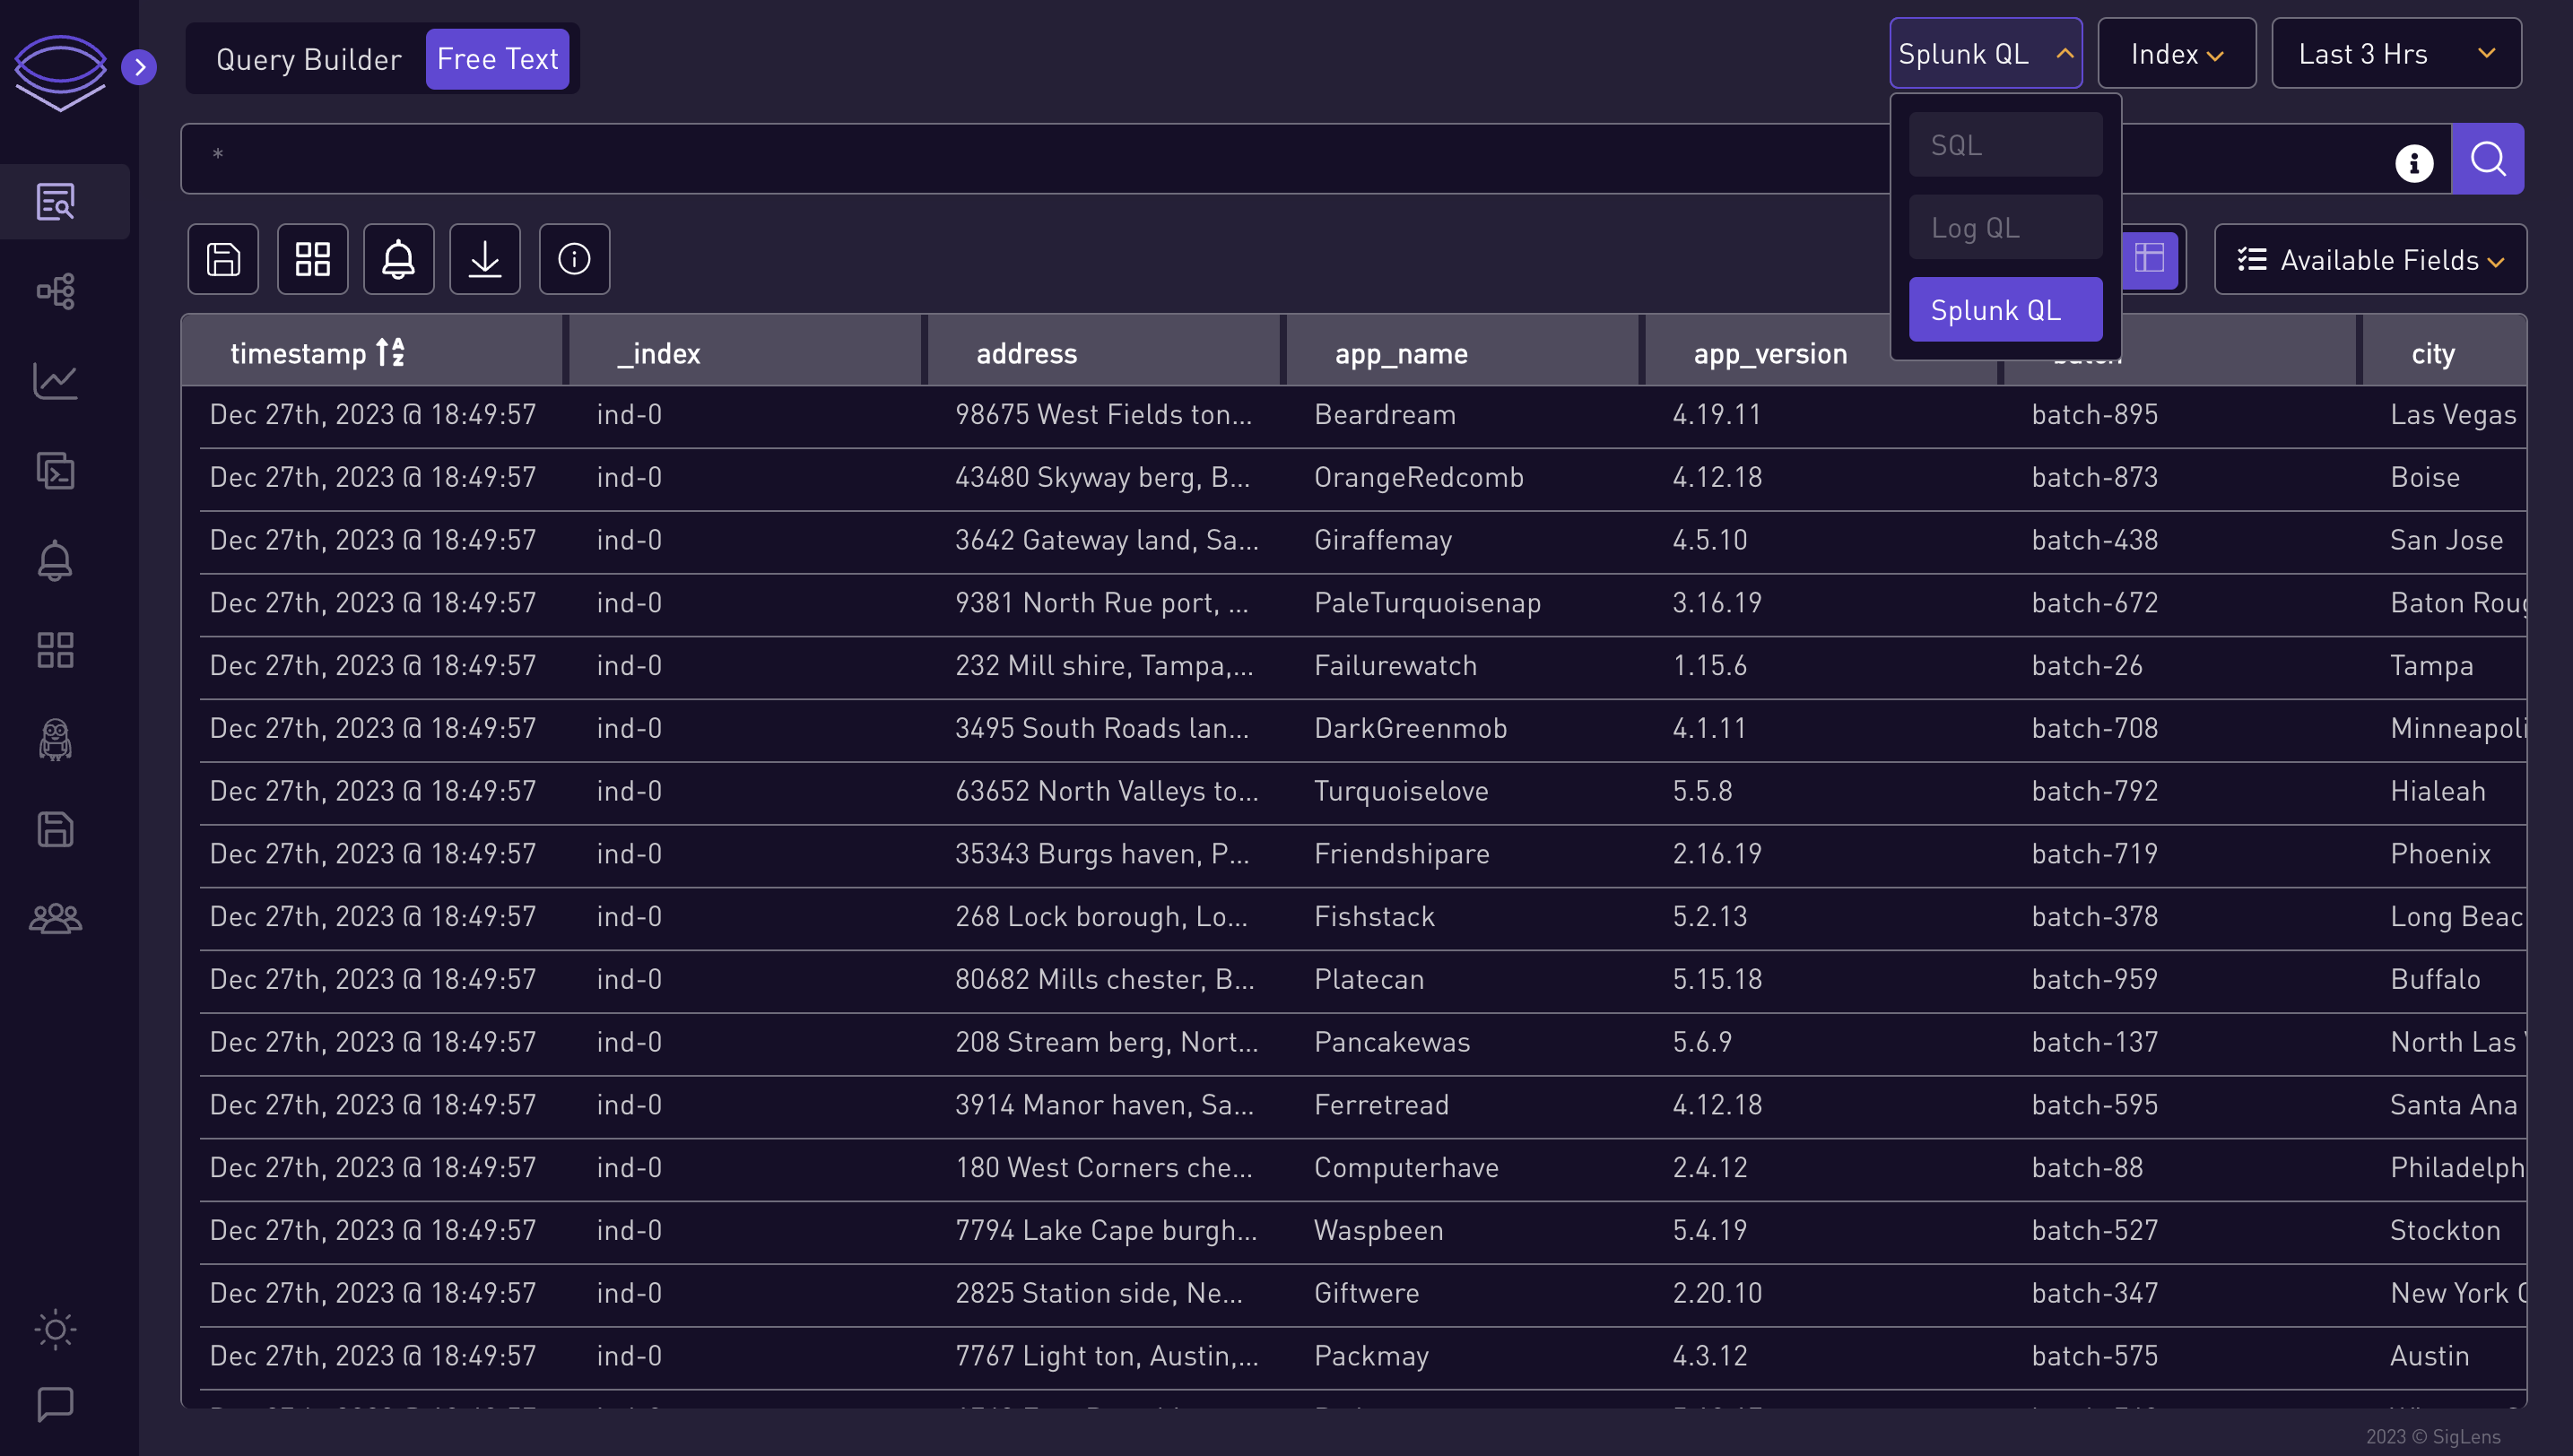
Choose Query Type:
-
Select which type of query you want to search: Splunk QL, LogQL.
-
-
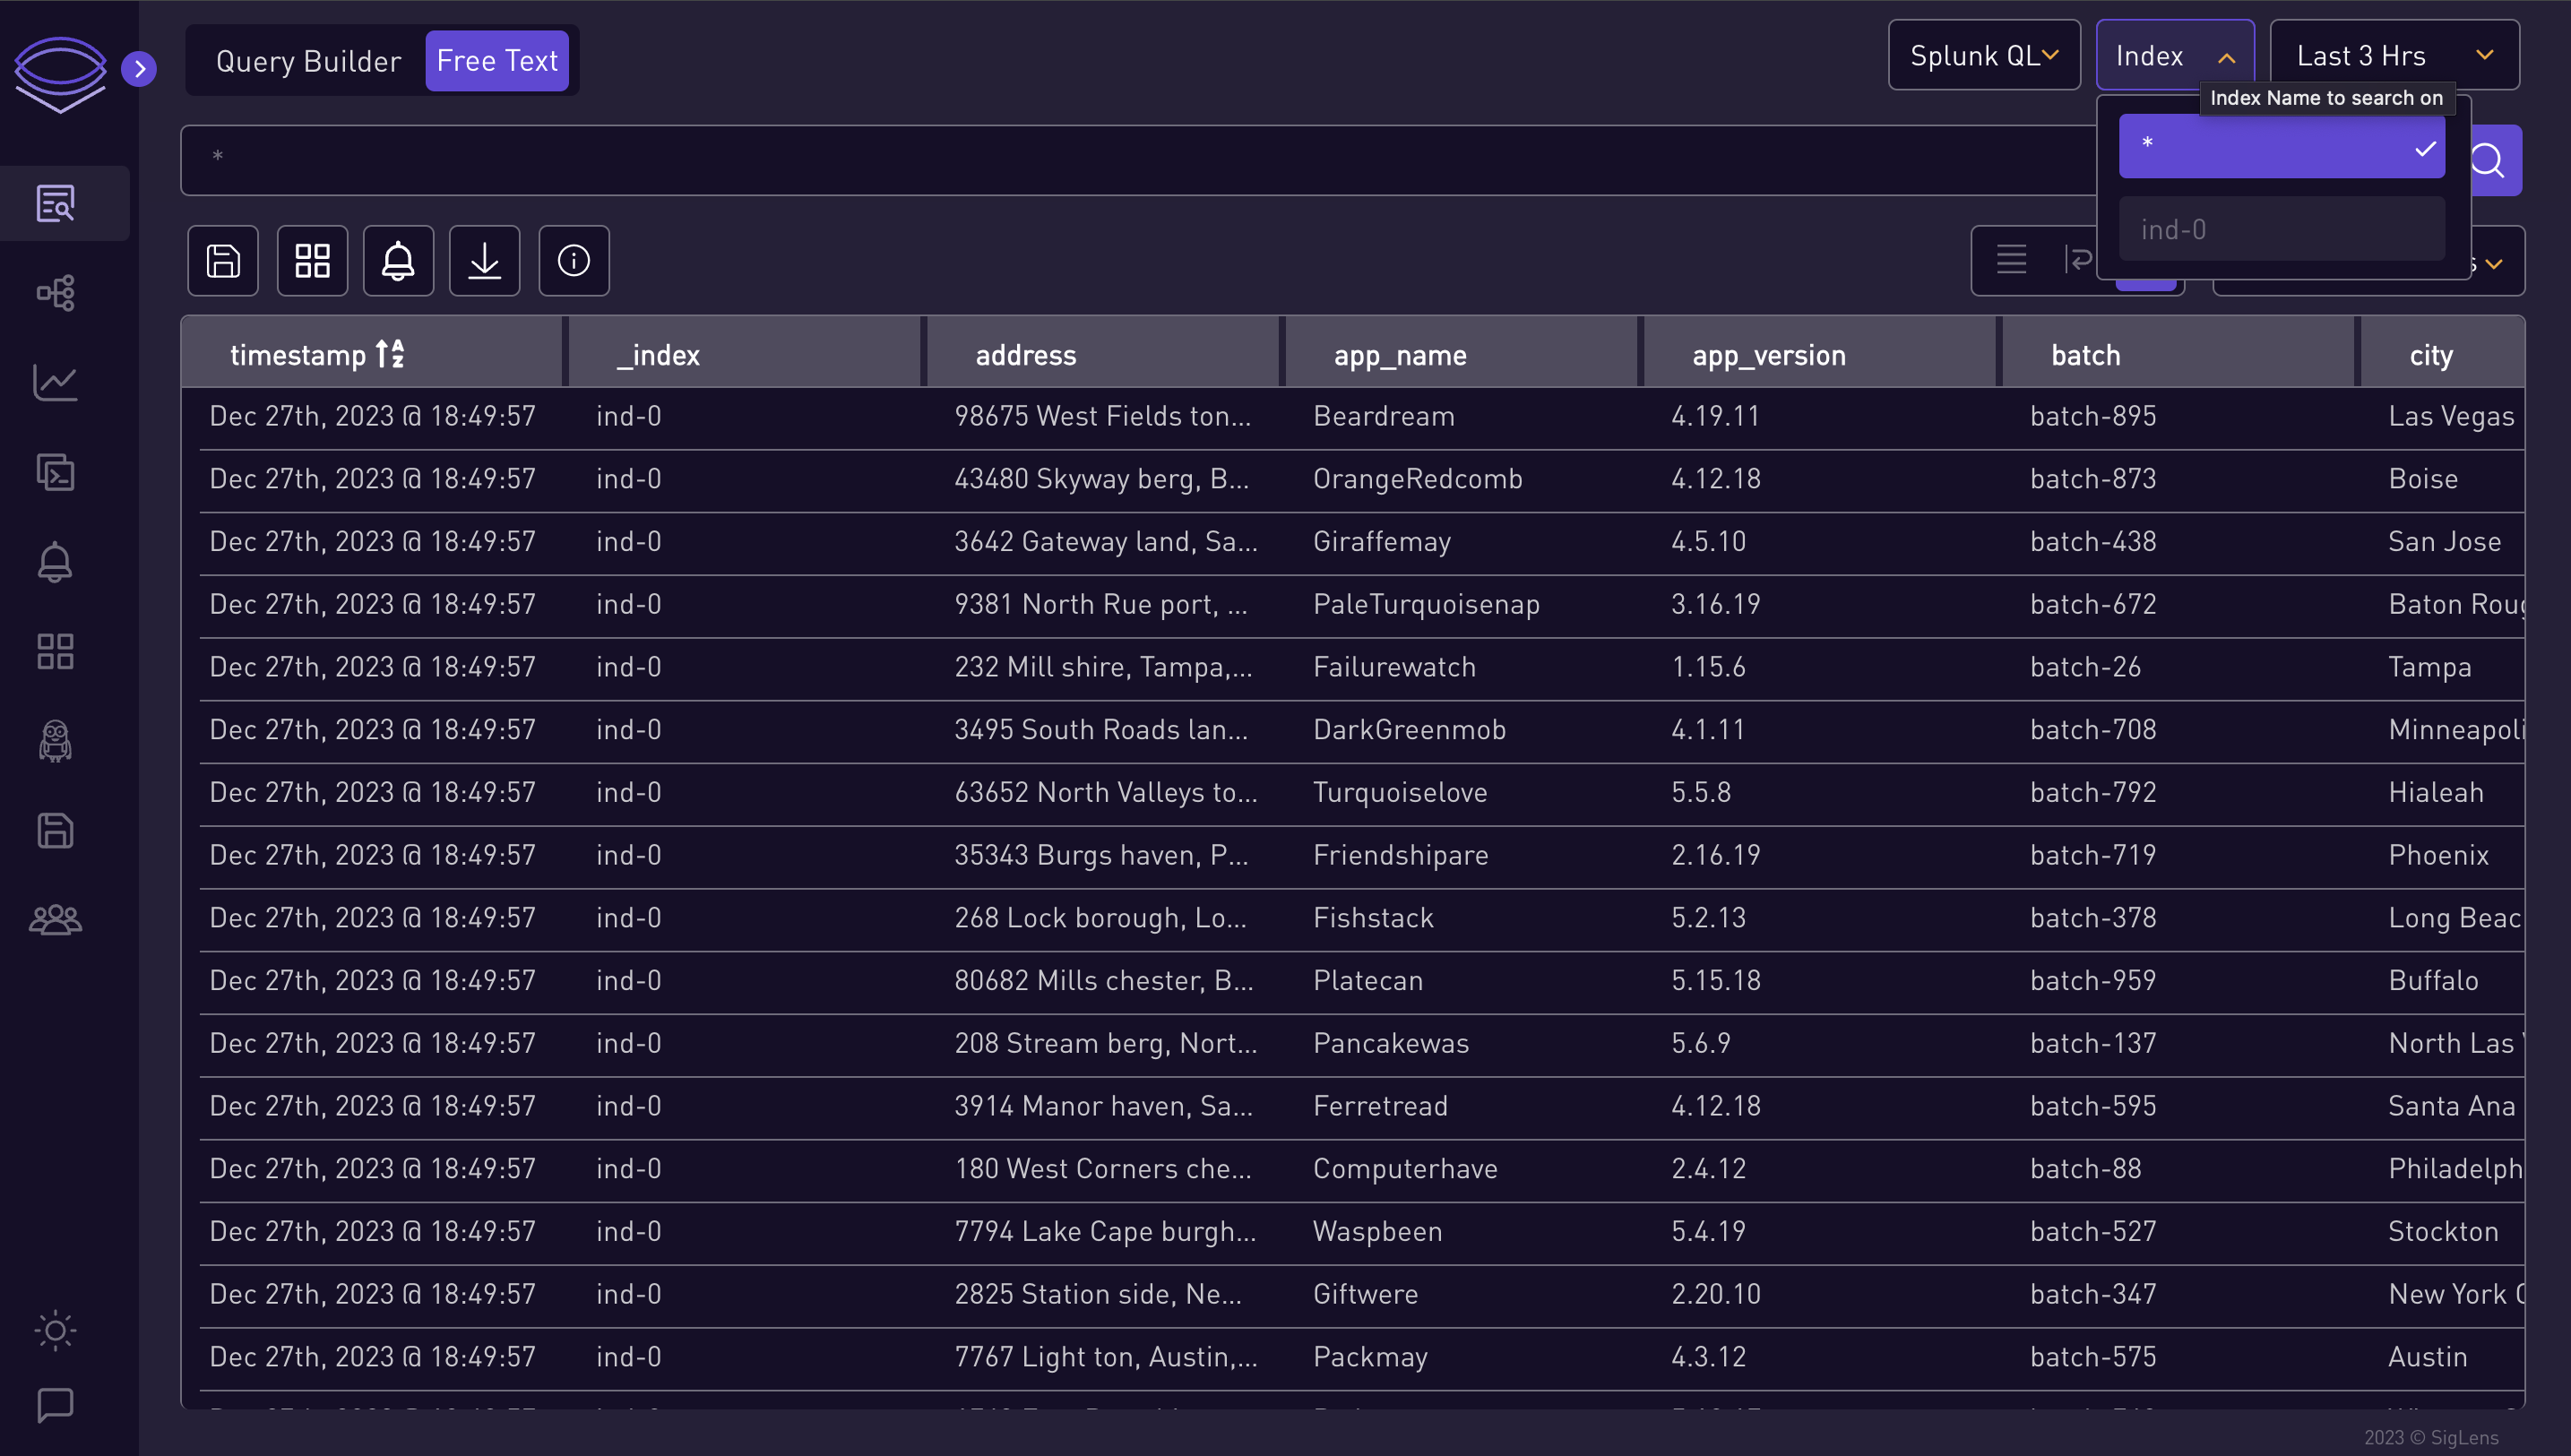
Select Index:
-
Choose an index from the index dropdown.
-
-
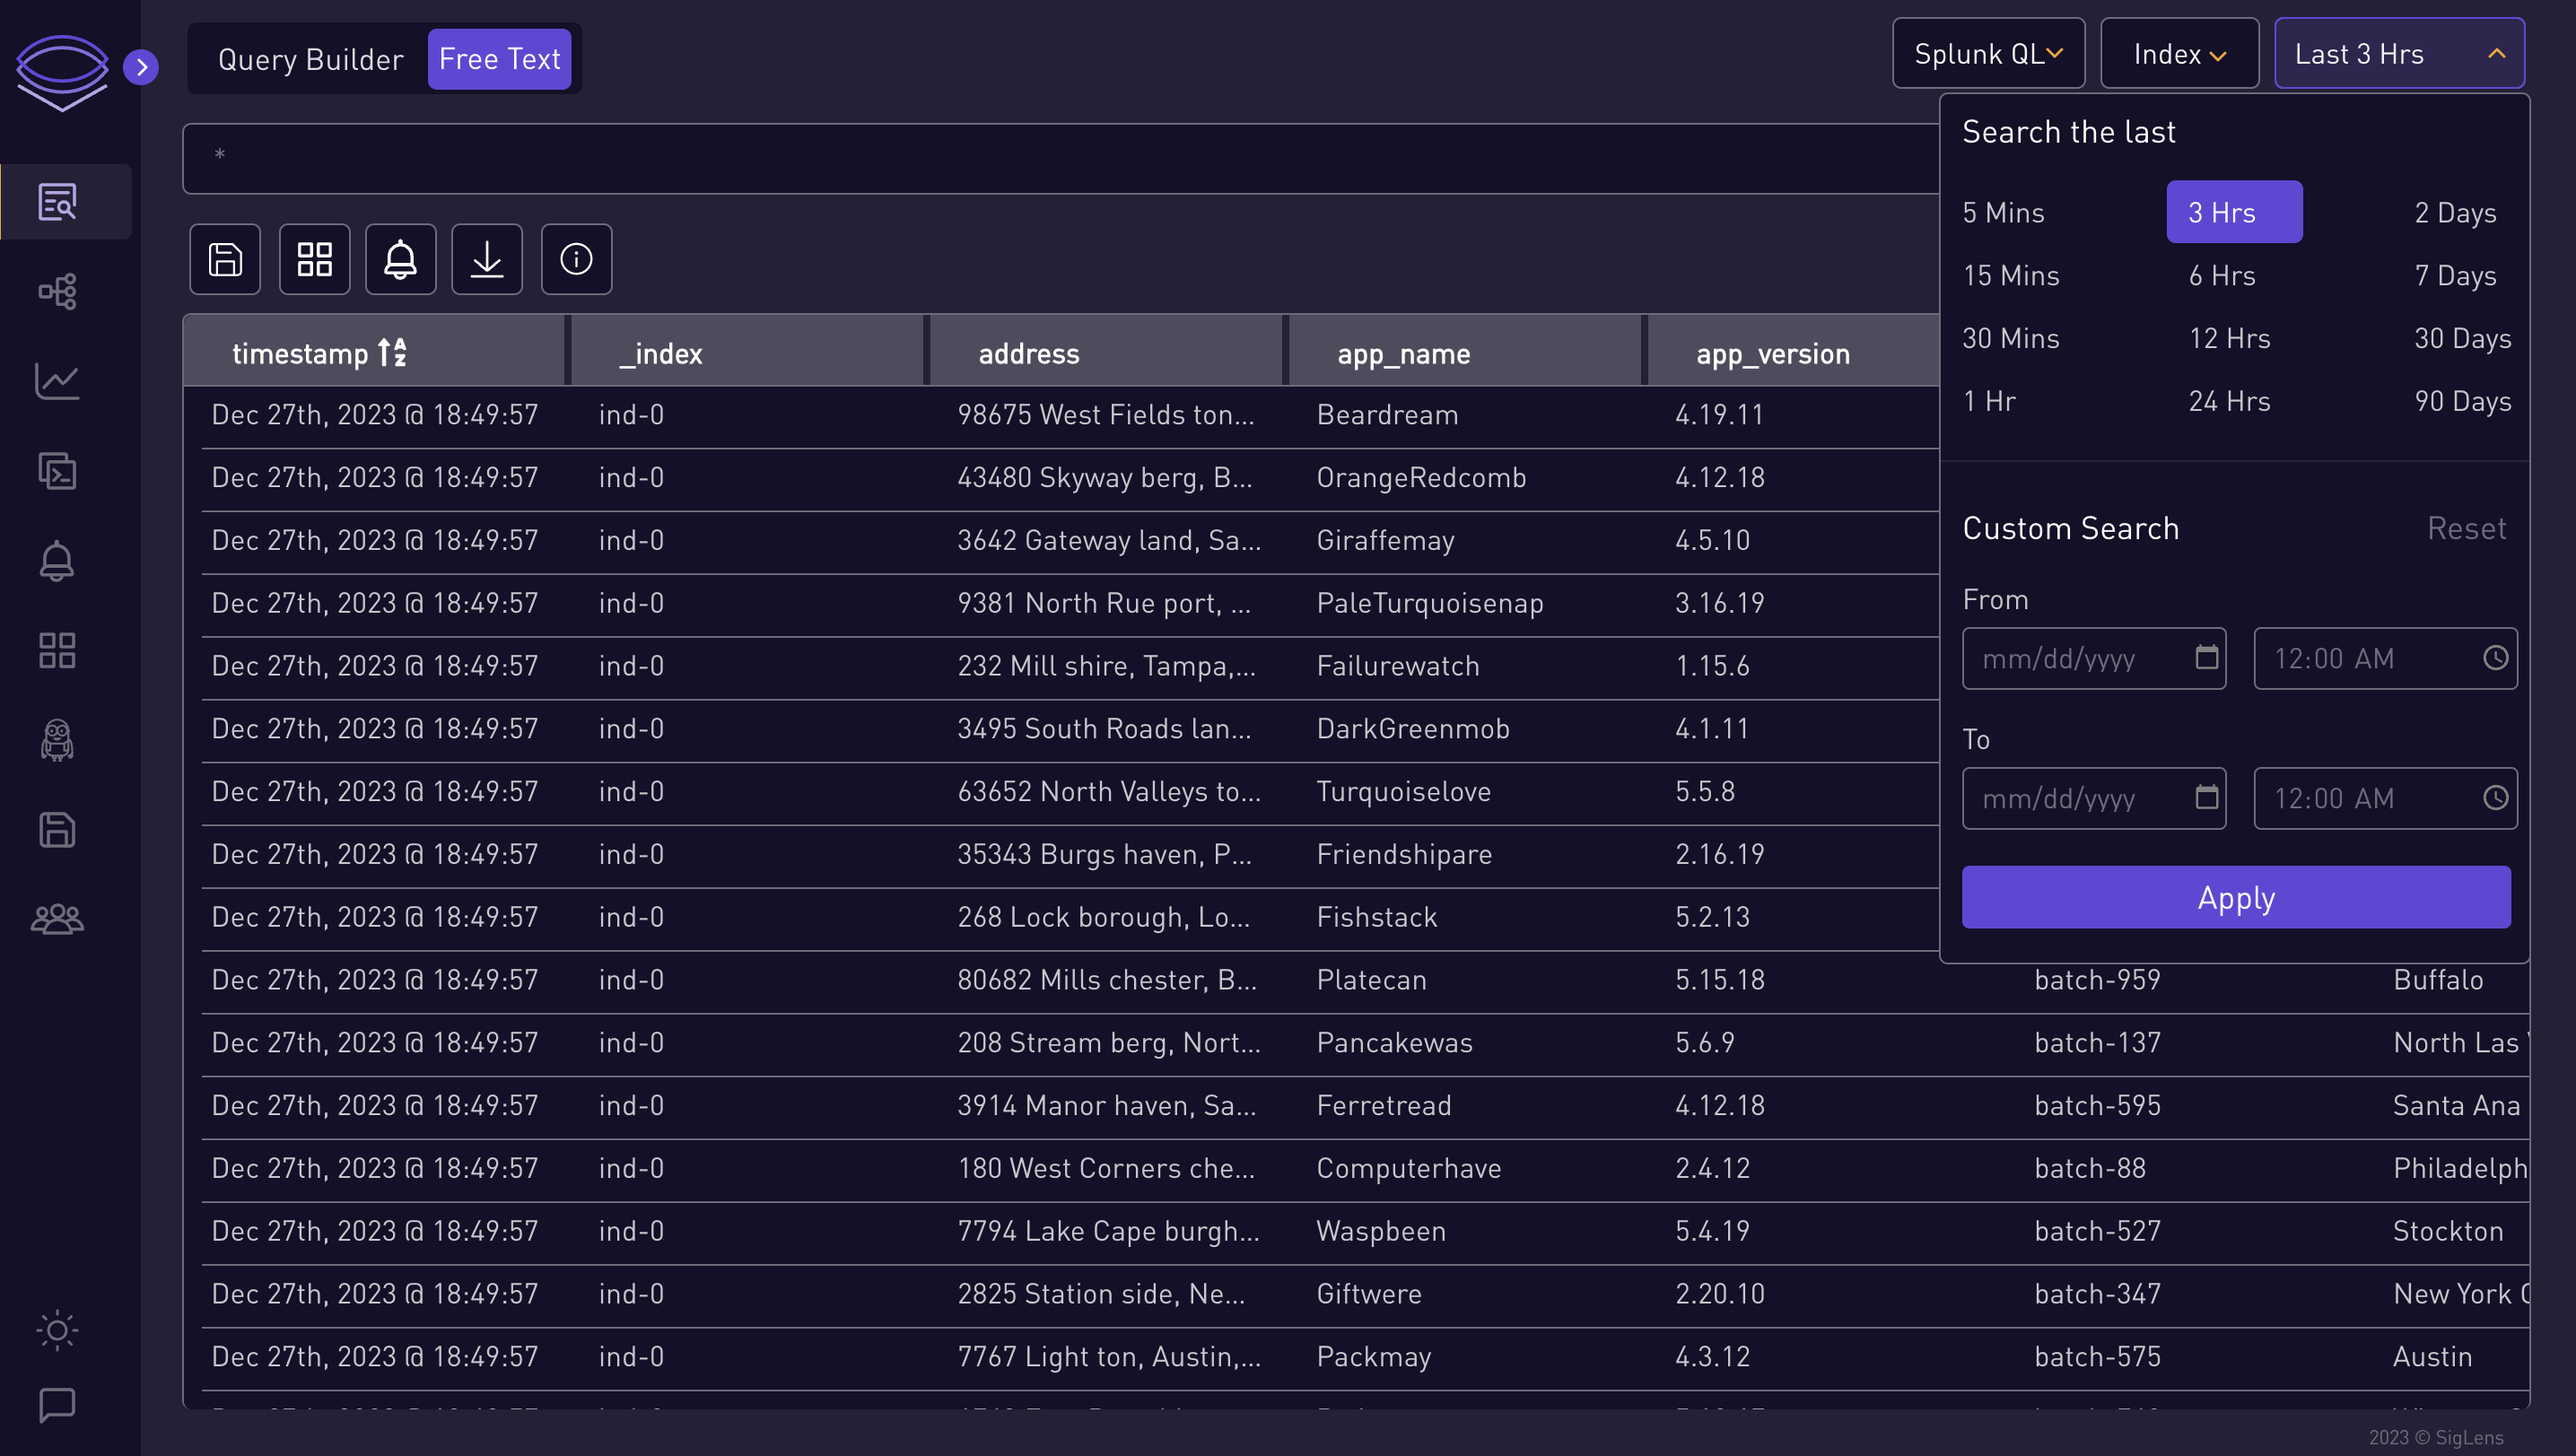
Set Time Range:
-
Select the time range for the query.
⭐ Splunk QL Query Examples ⭐
city=Boston | stats count AS Count BY weekday | where Count / 2 > 6 OR weekday = "Saturday"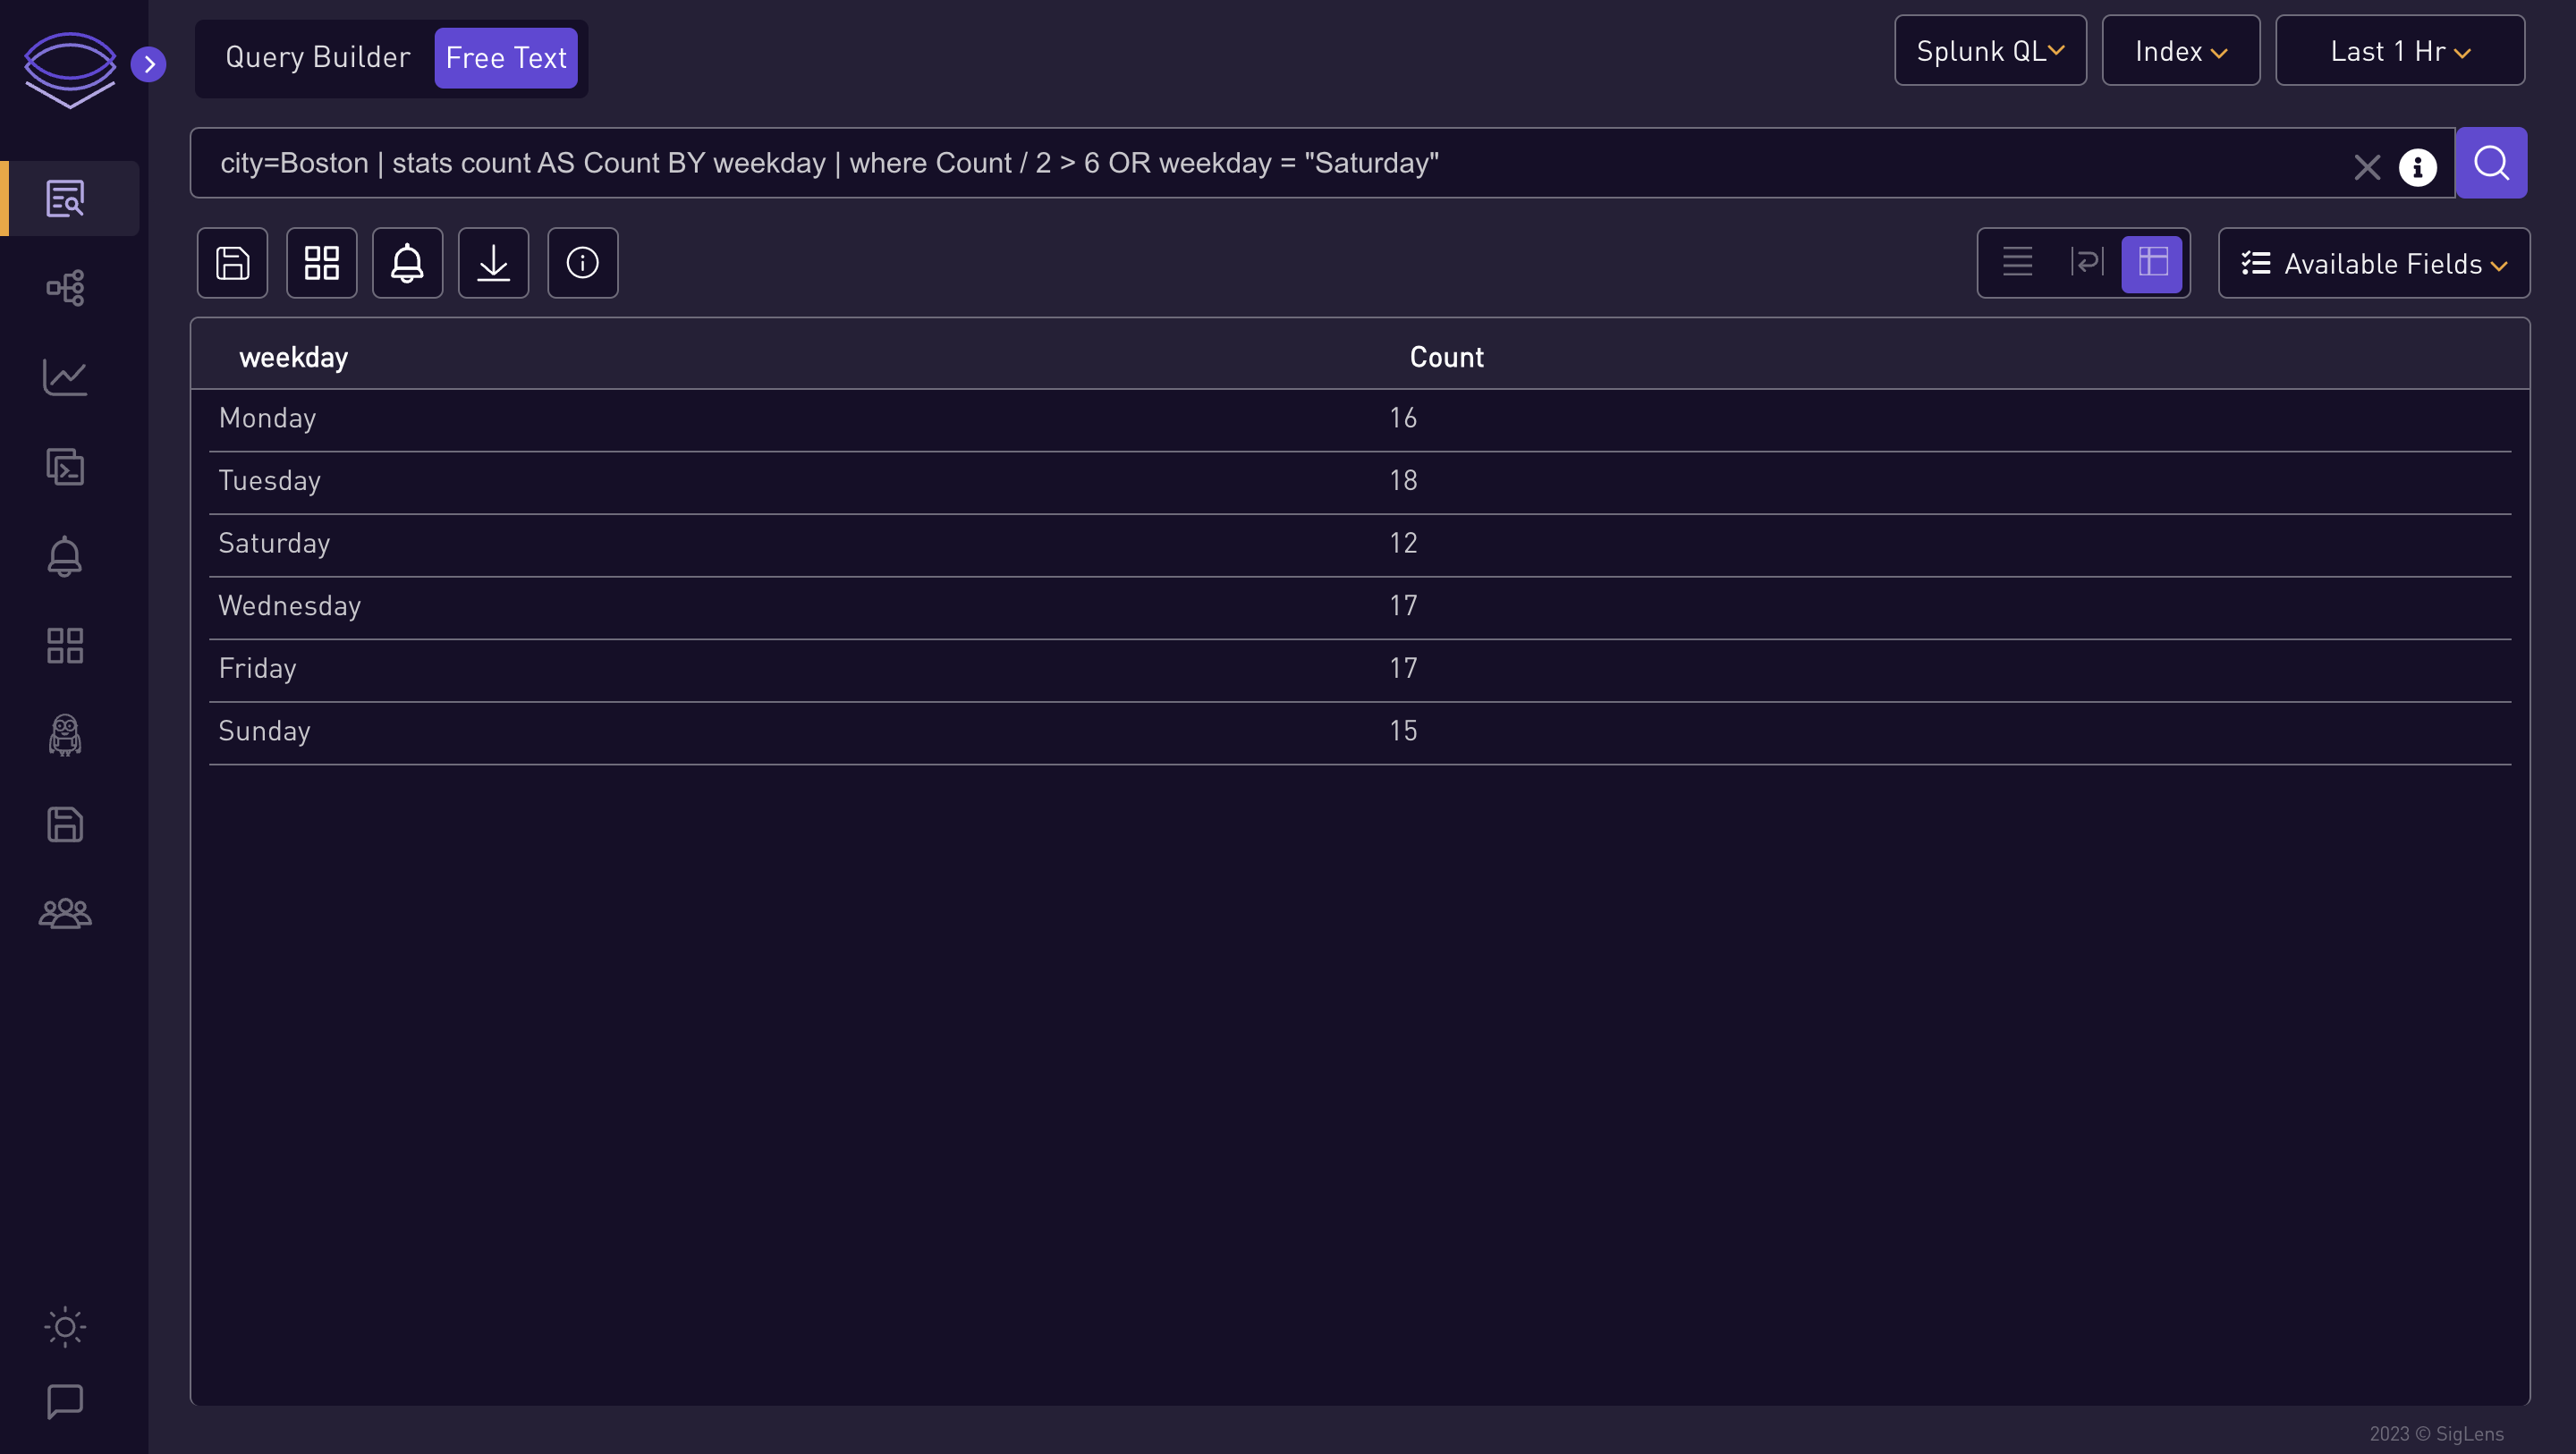
http_method=POST | regex city="^[a-zA-Z]+\s[a-zA-Z]+$" | fields city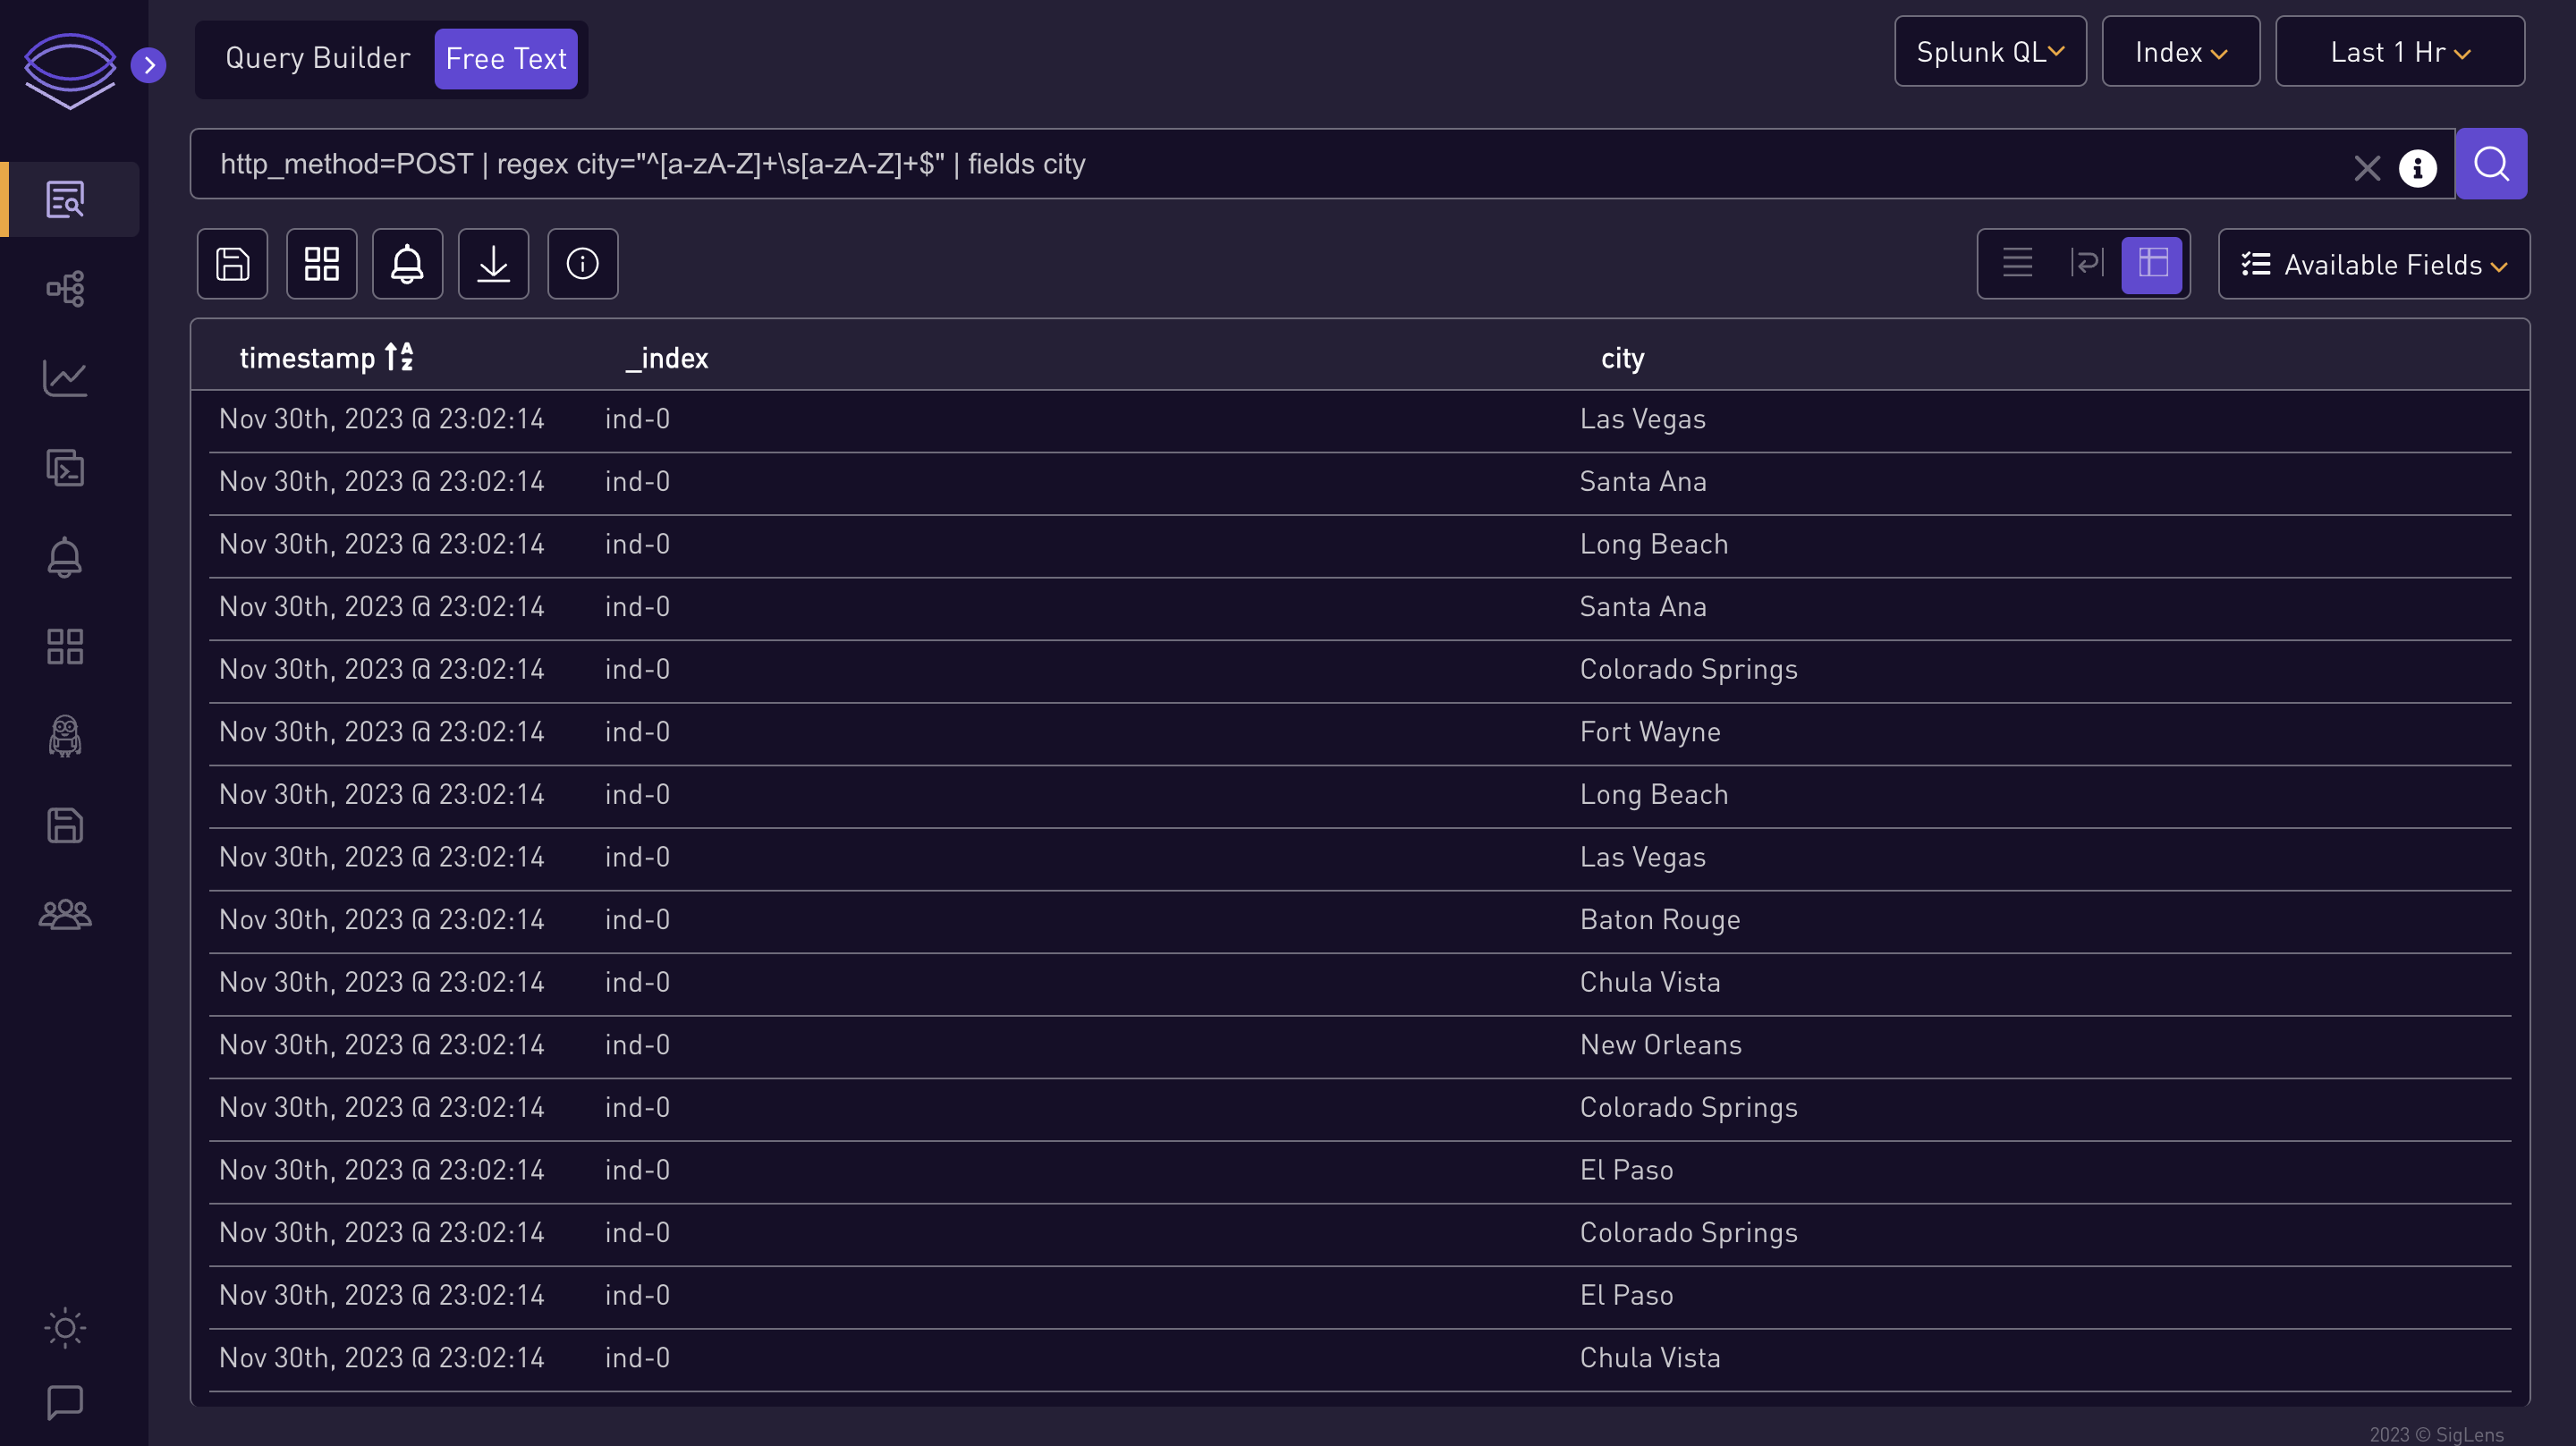
city=Boston | stats count AS Count BY state | eval myField=state . " start:" . rtrim(state, "nd")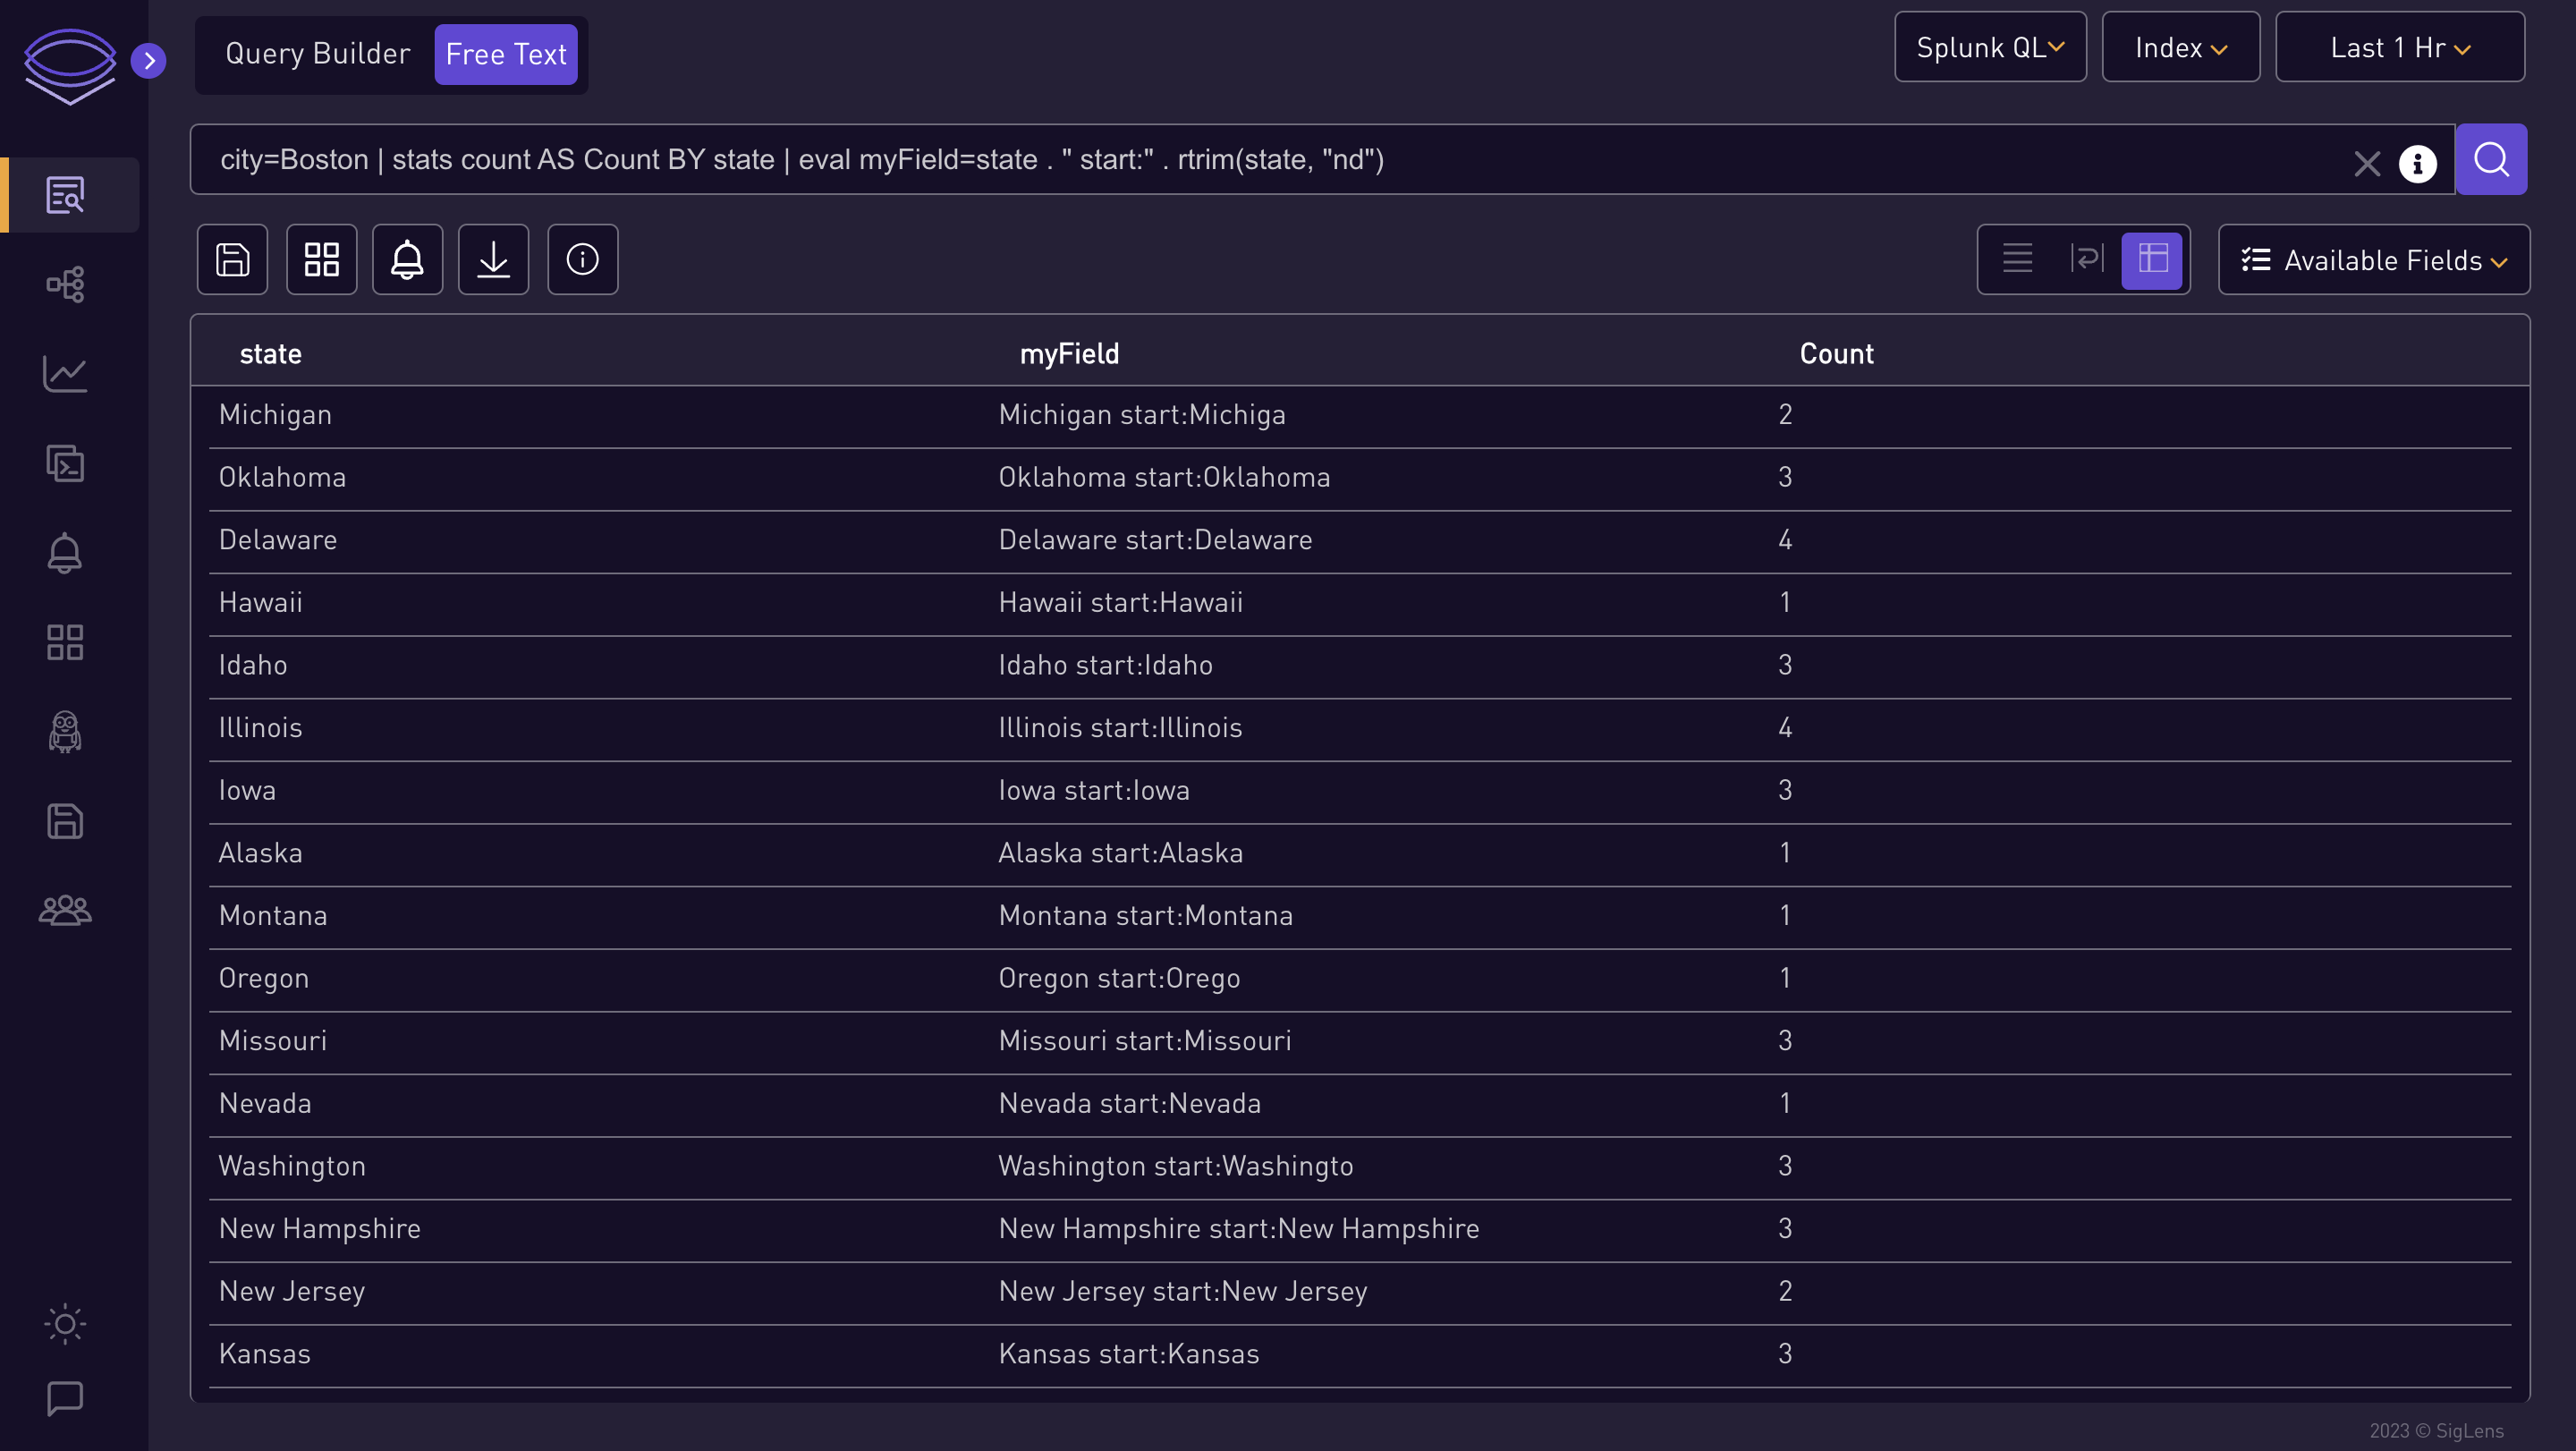
city=Boston | stats count AS Count BY state | eval myField=if(in(state, "Mary" . "land", "Hawaii", 99 + 1), state, "Error")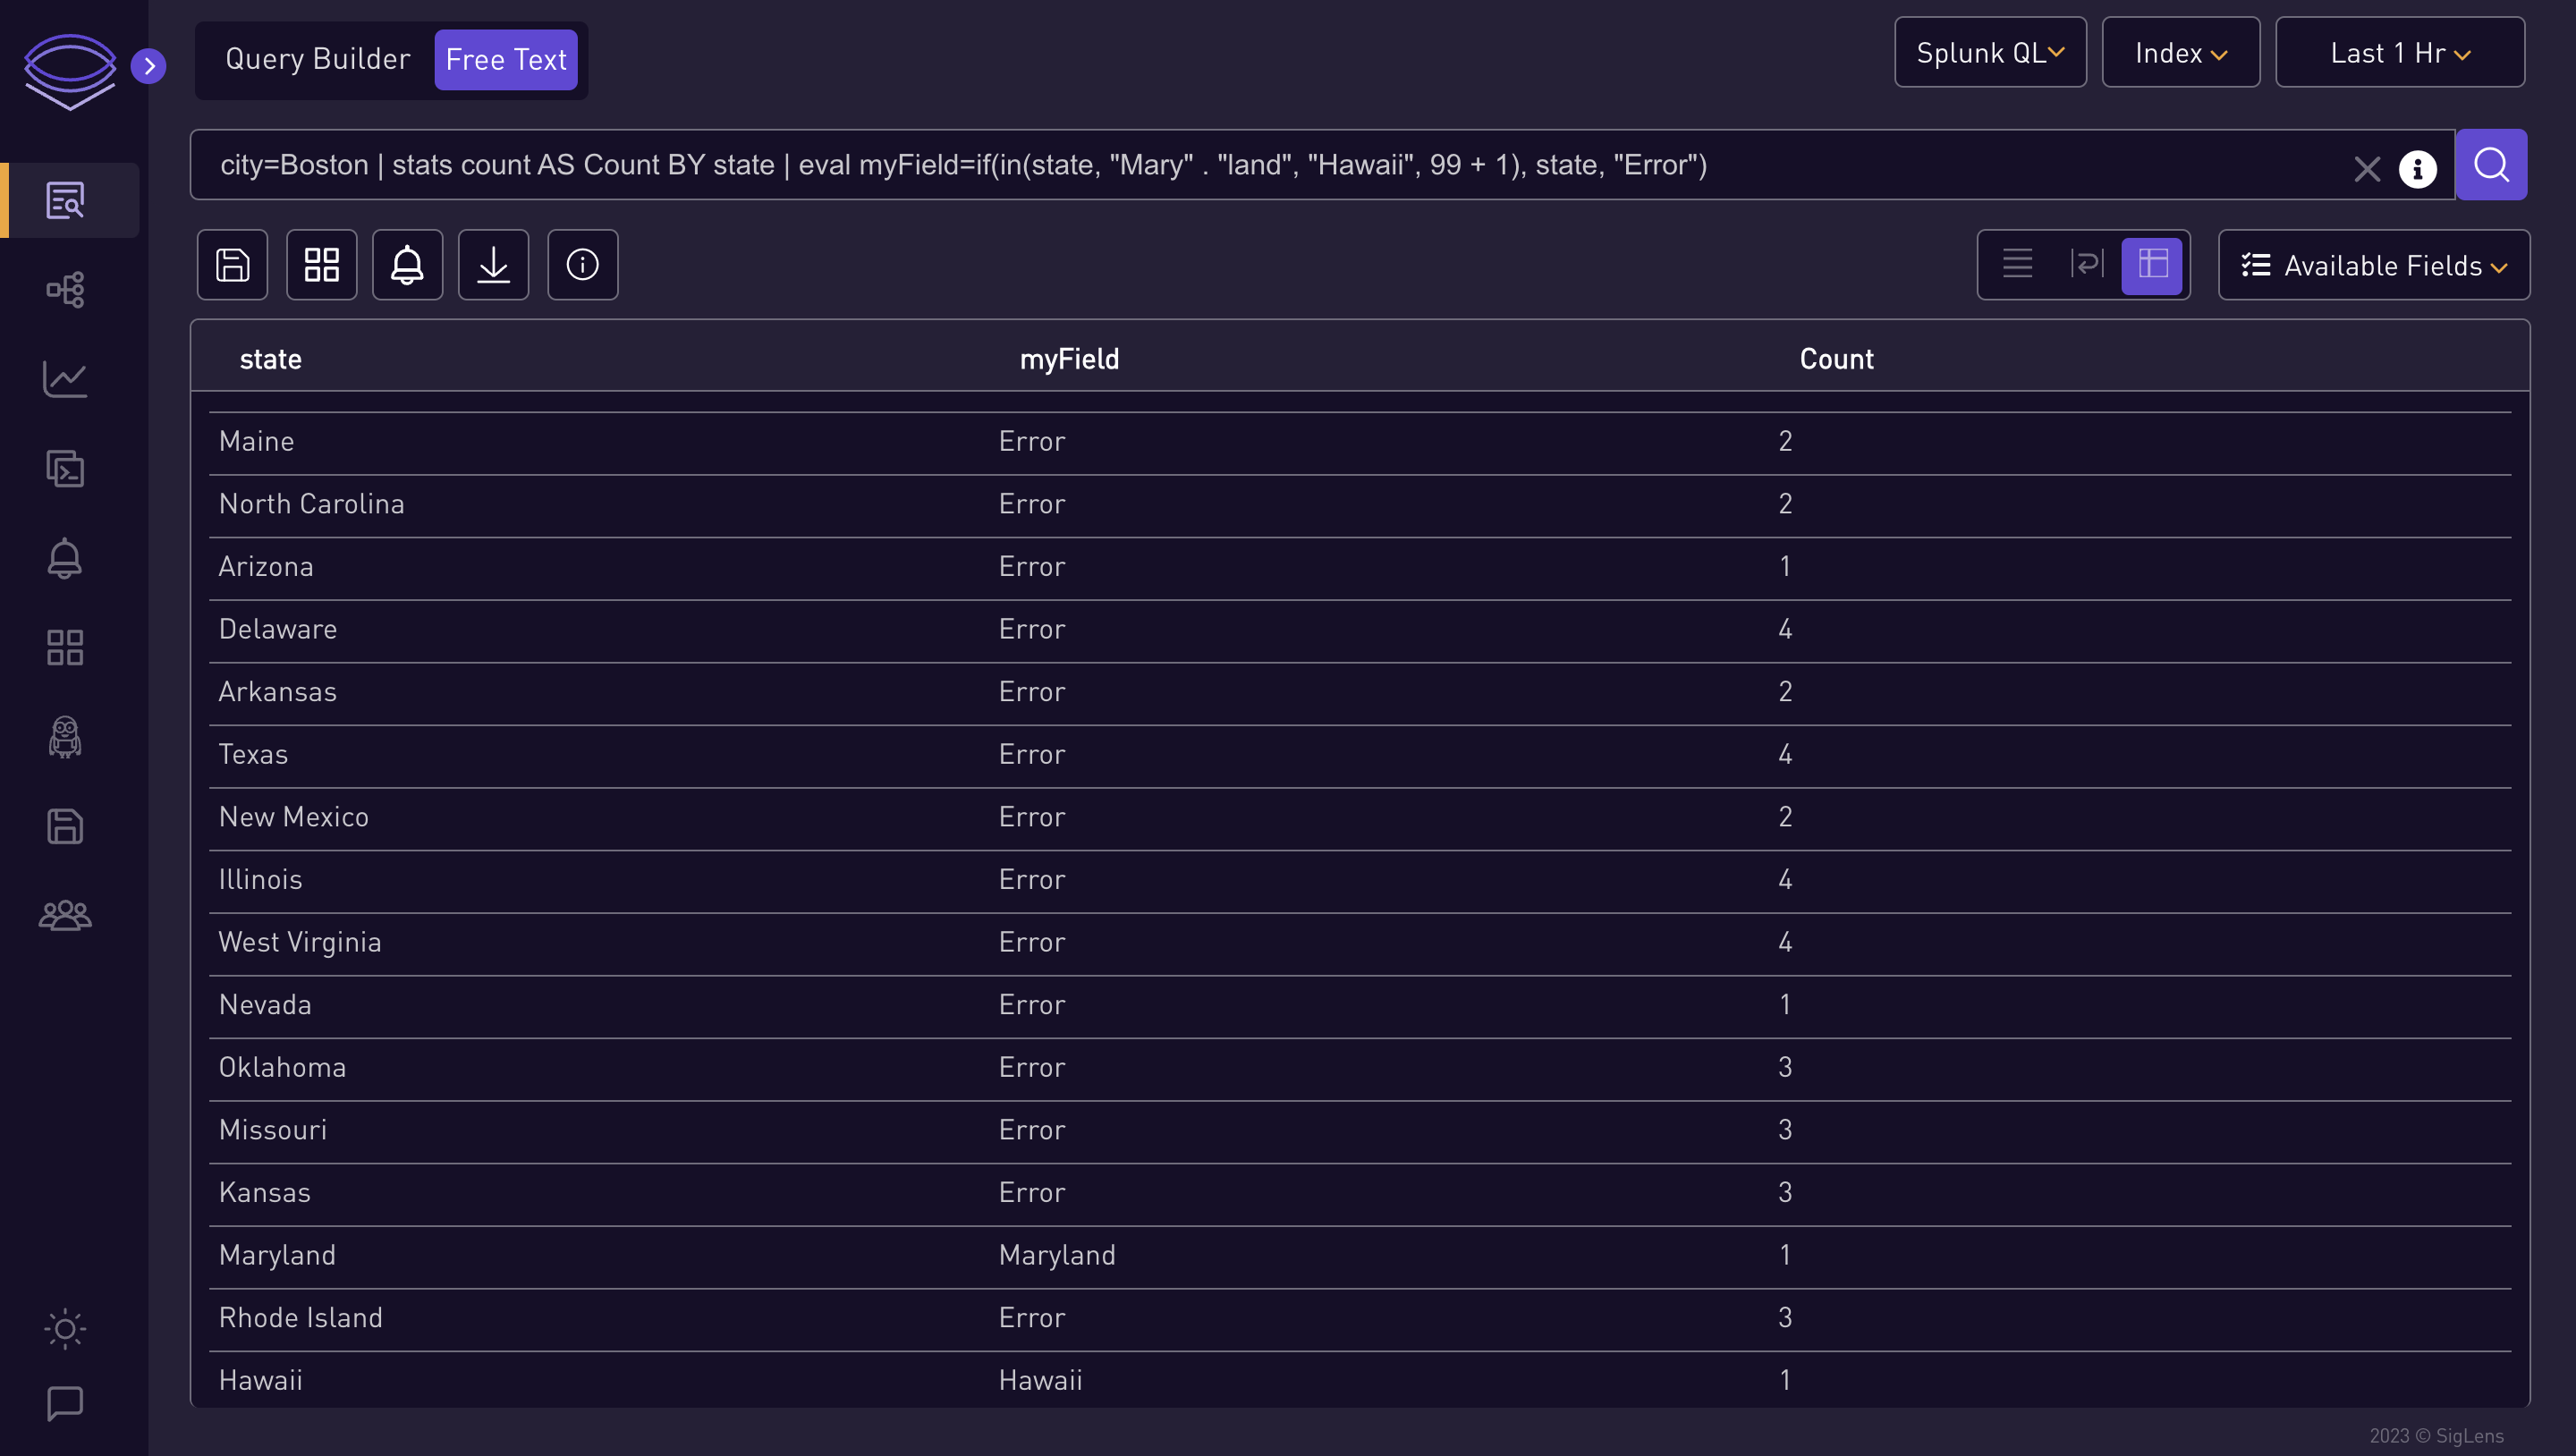
city=Columbus | stats count AS Count BY http_status | eval sqrt=sqrt(http_status + 200)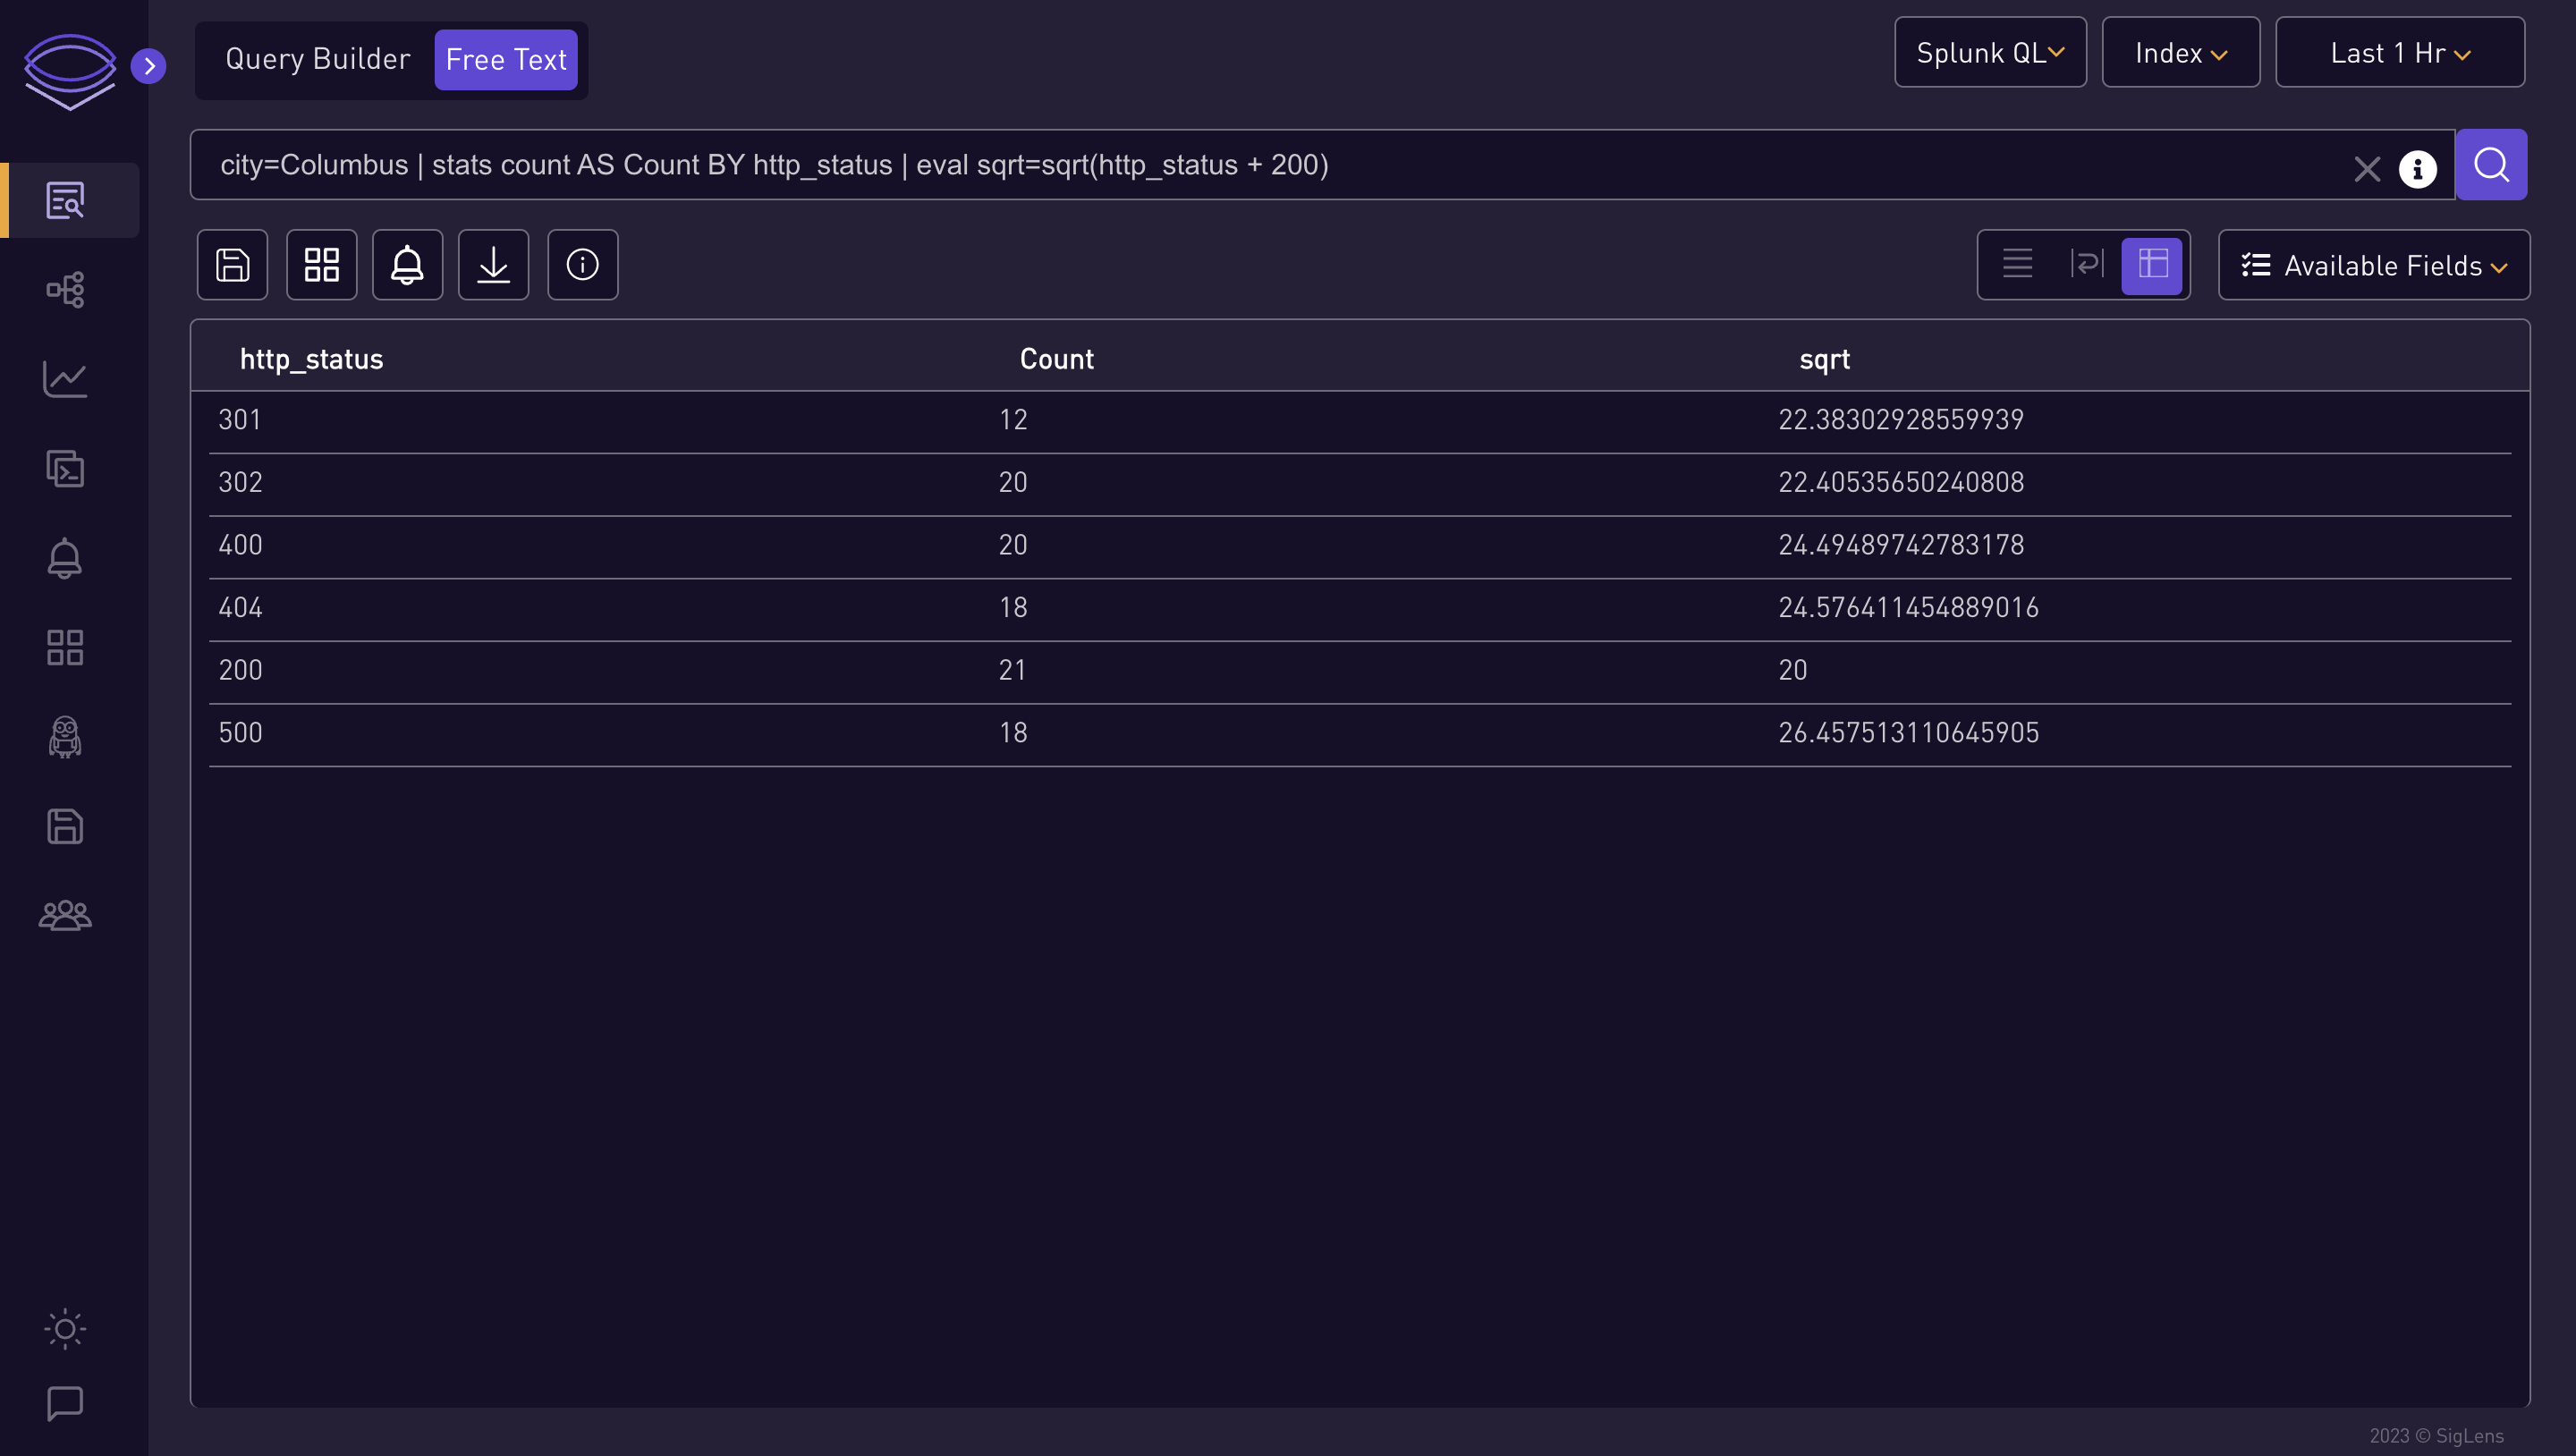
⭐ Log QL Query Examples ⭐
{gender="female",city="Fresno"} != "batch-212"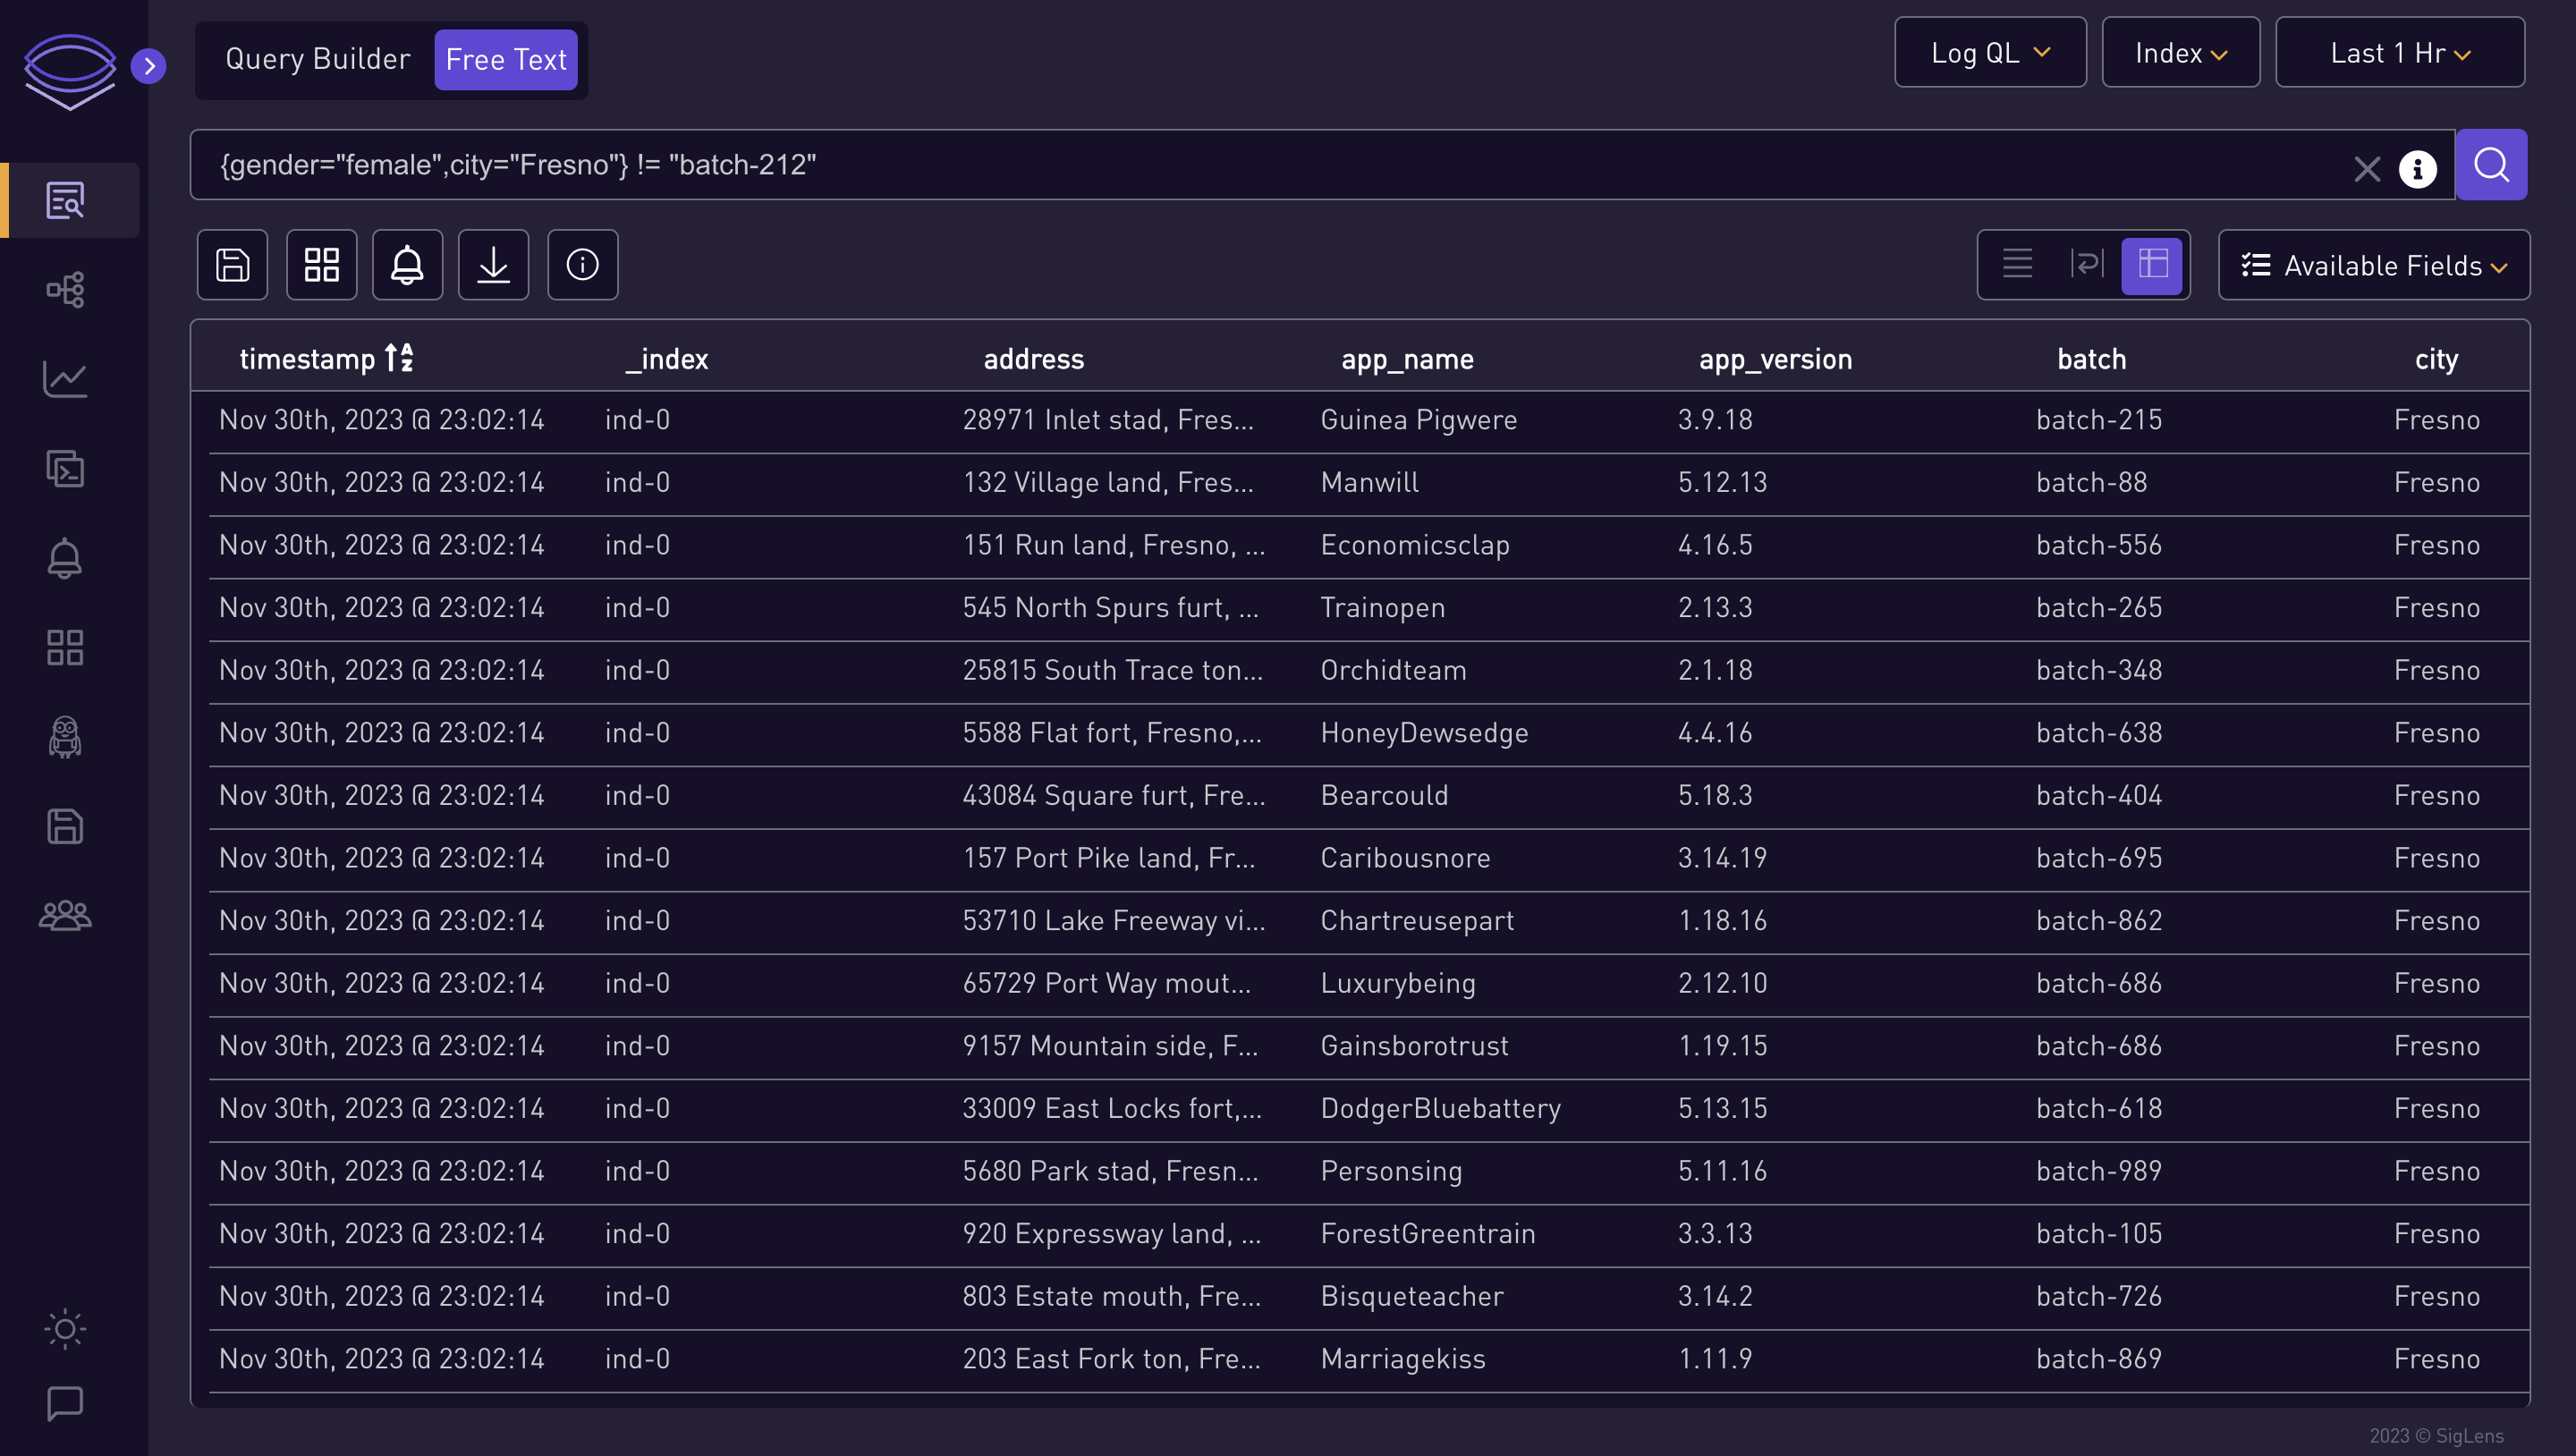
{gender="female"} | json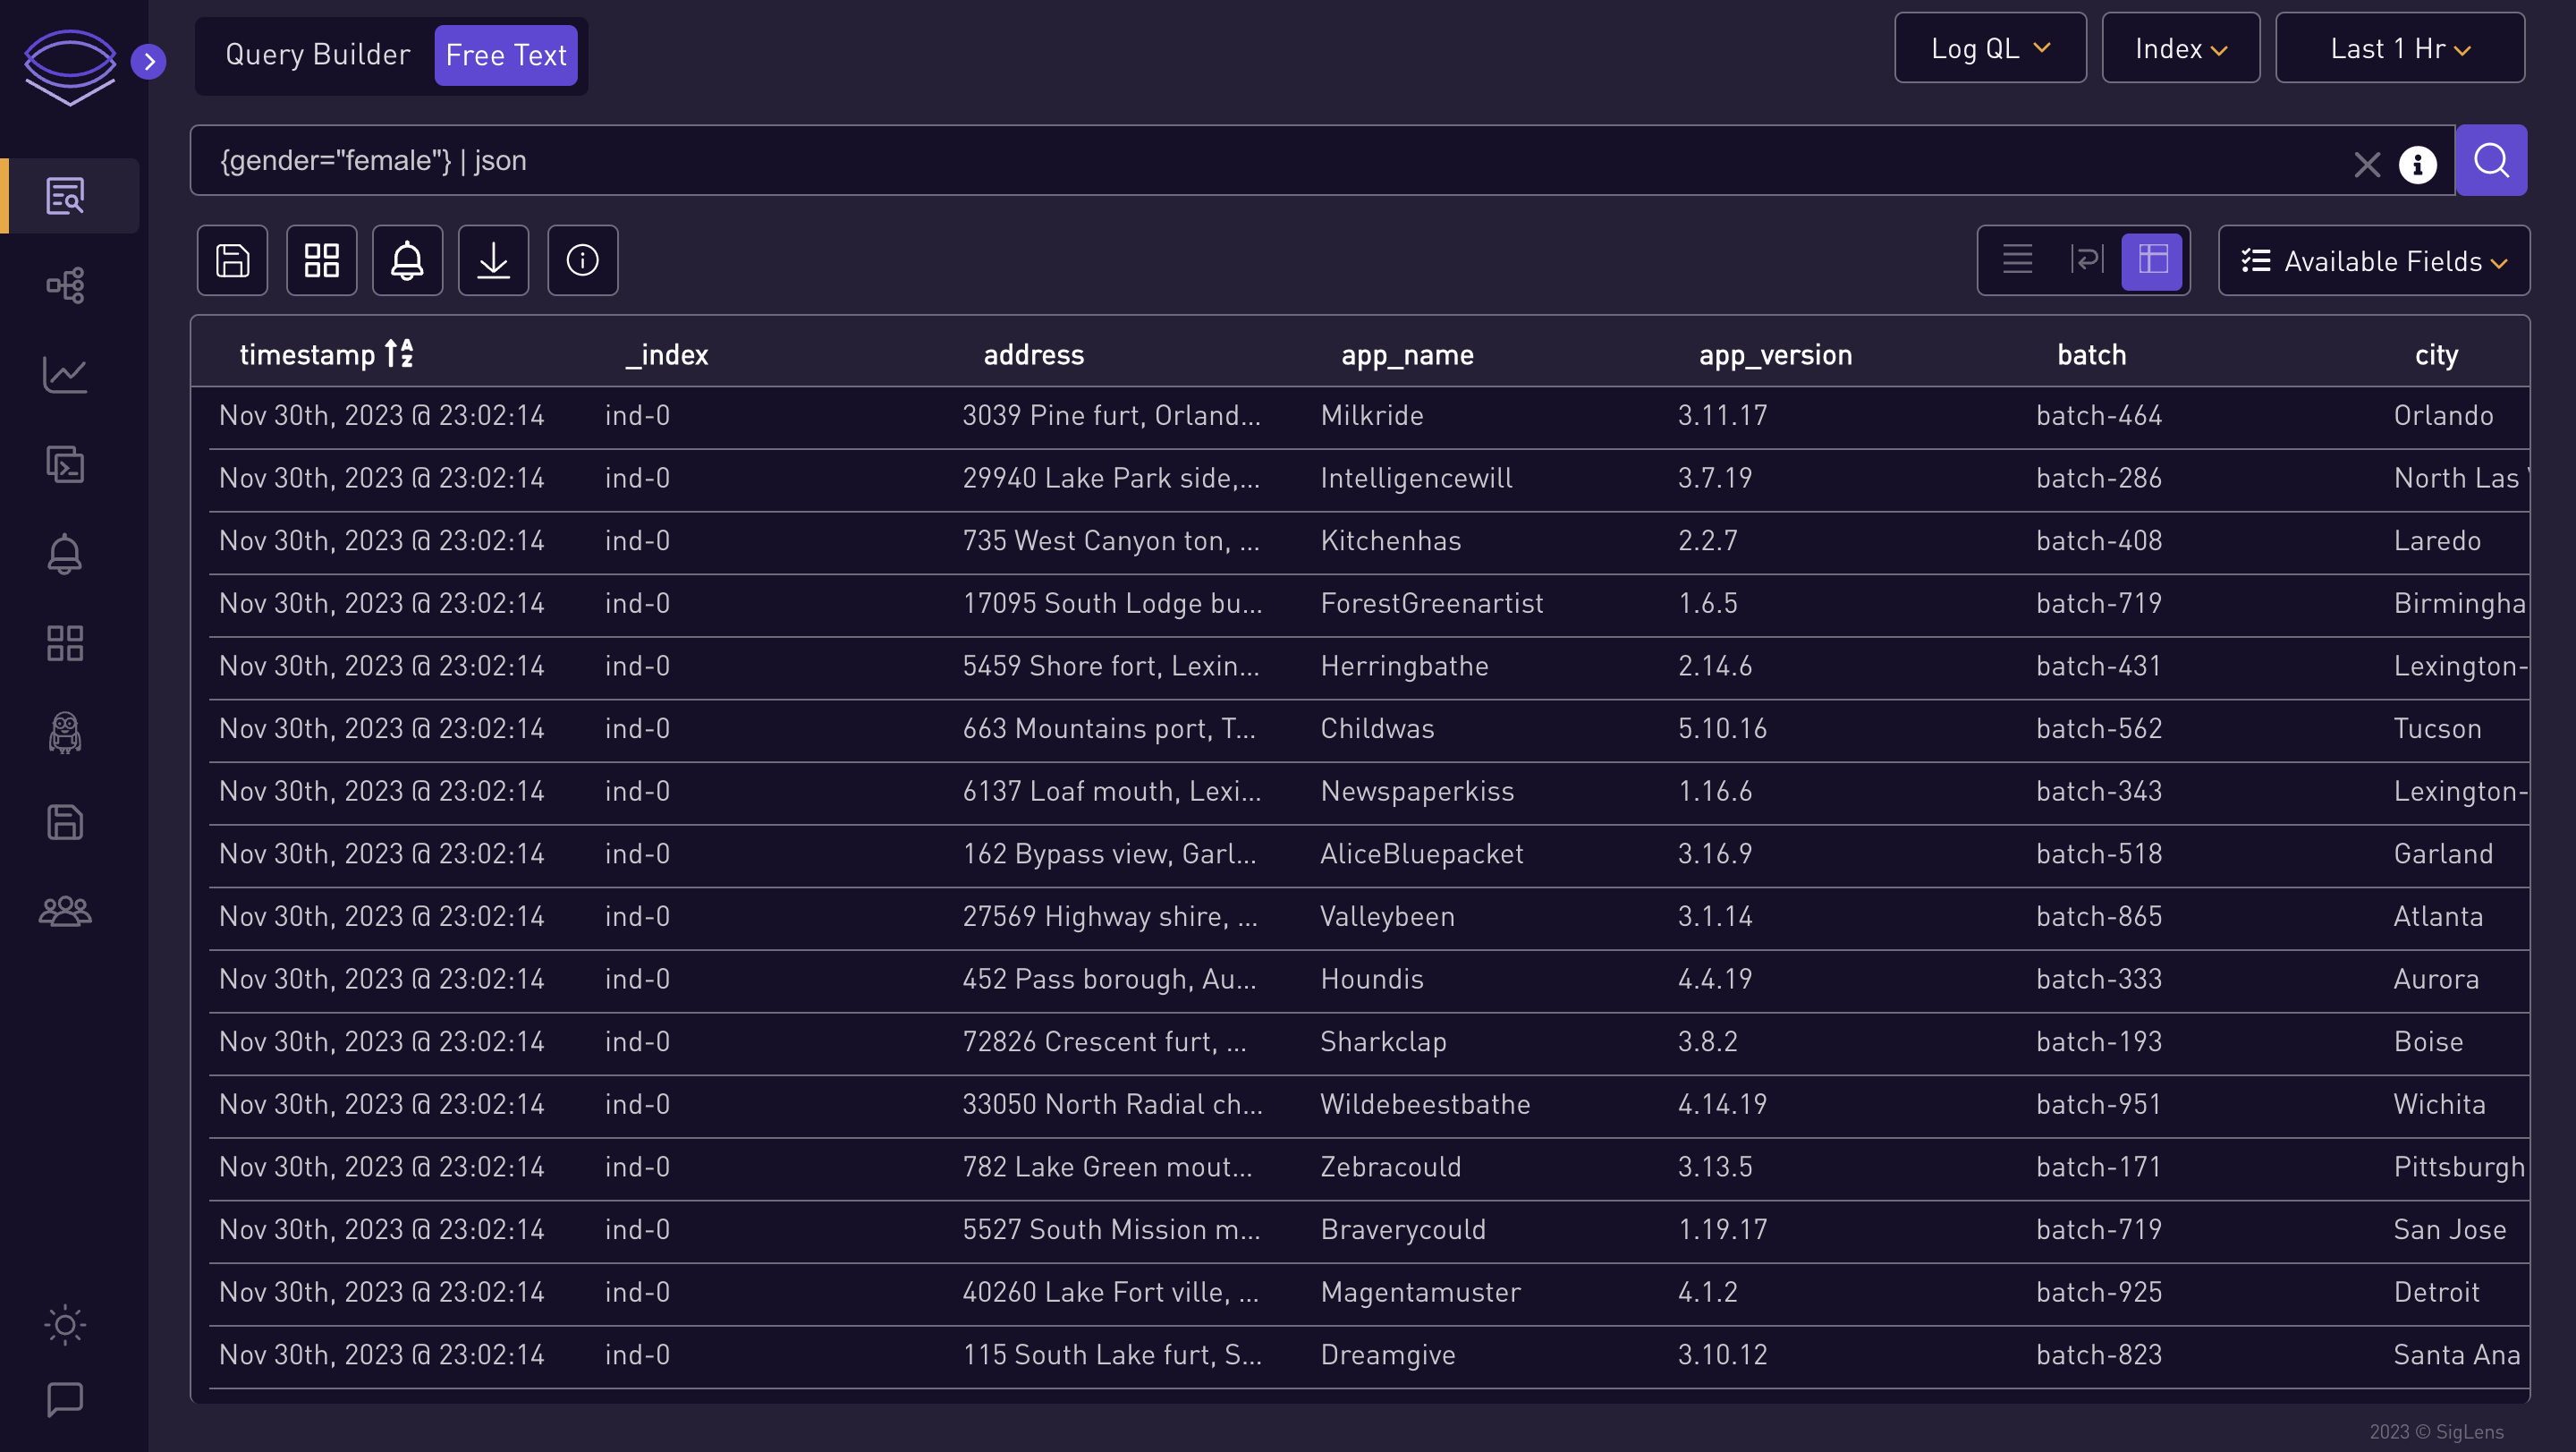
{gender="female"} | logfmt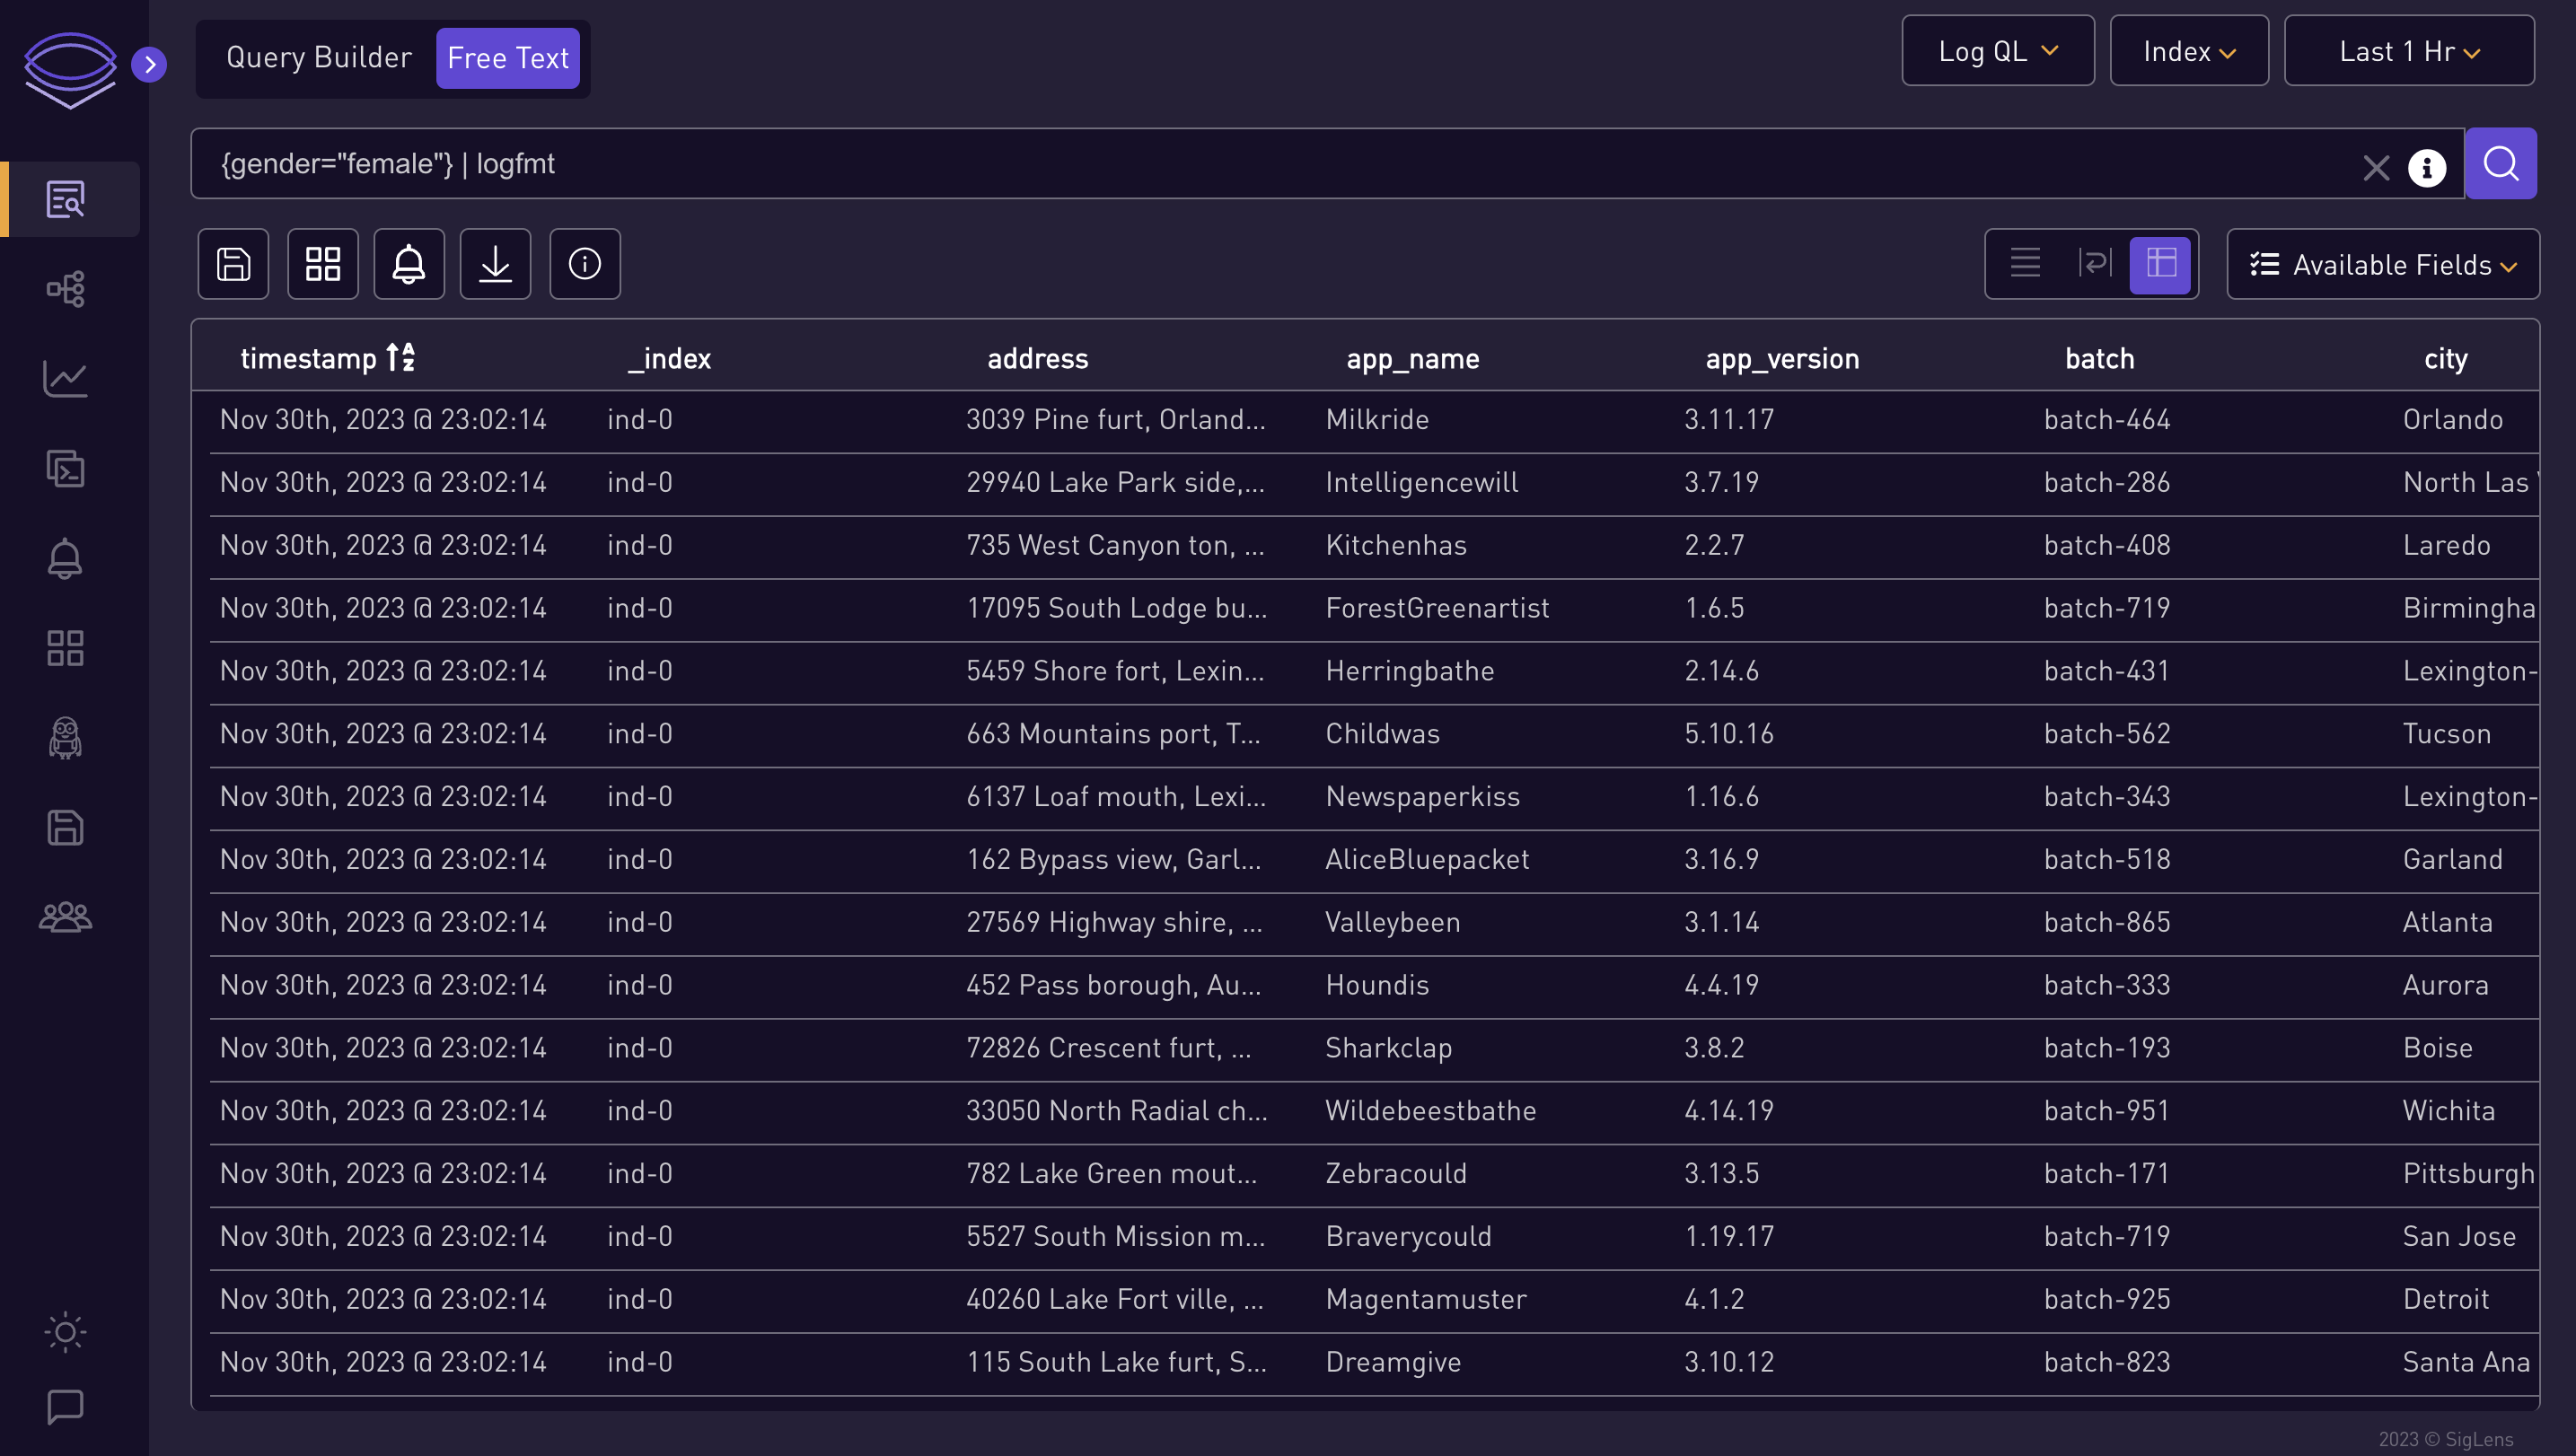
{gender="female",city="Fresno"} | json city_life="city", single_gender="gender[0]"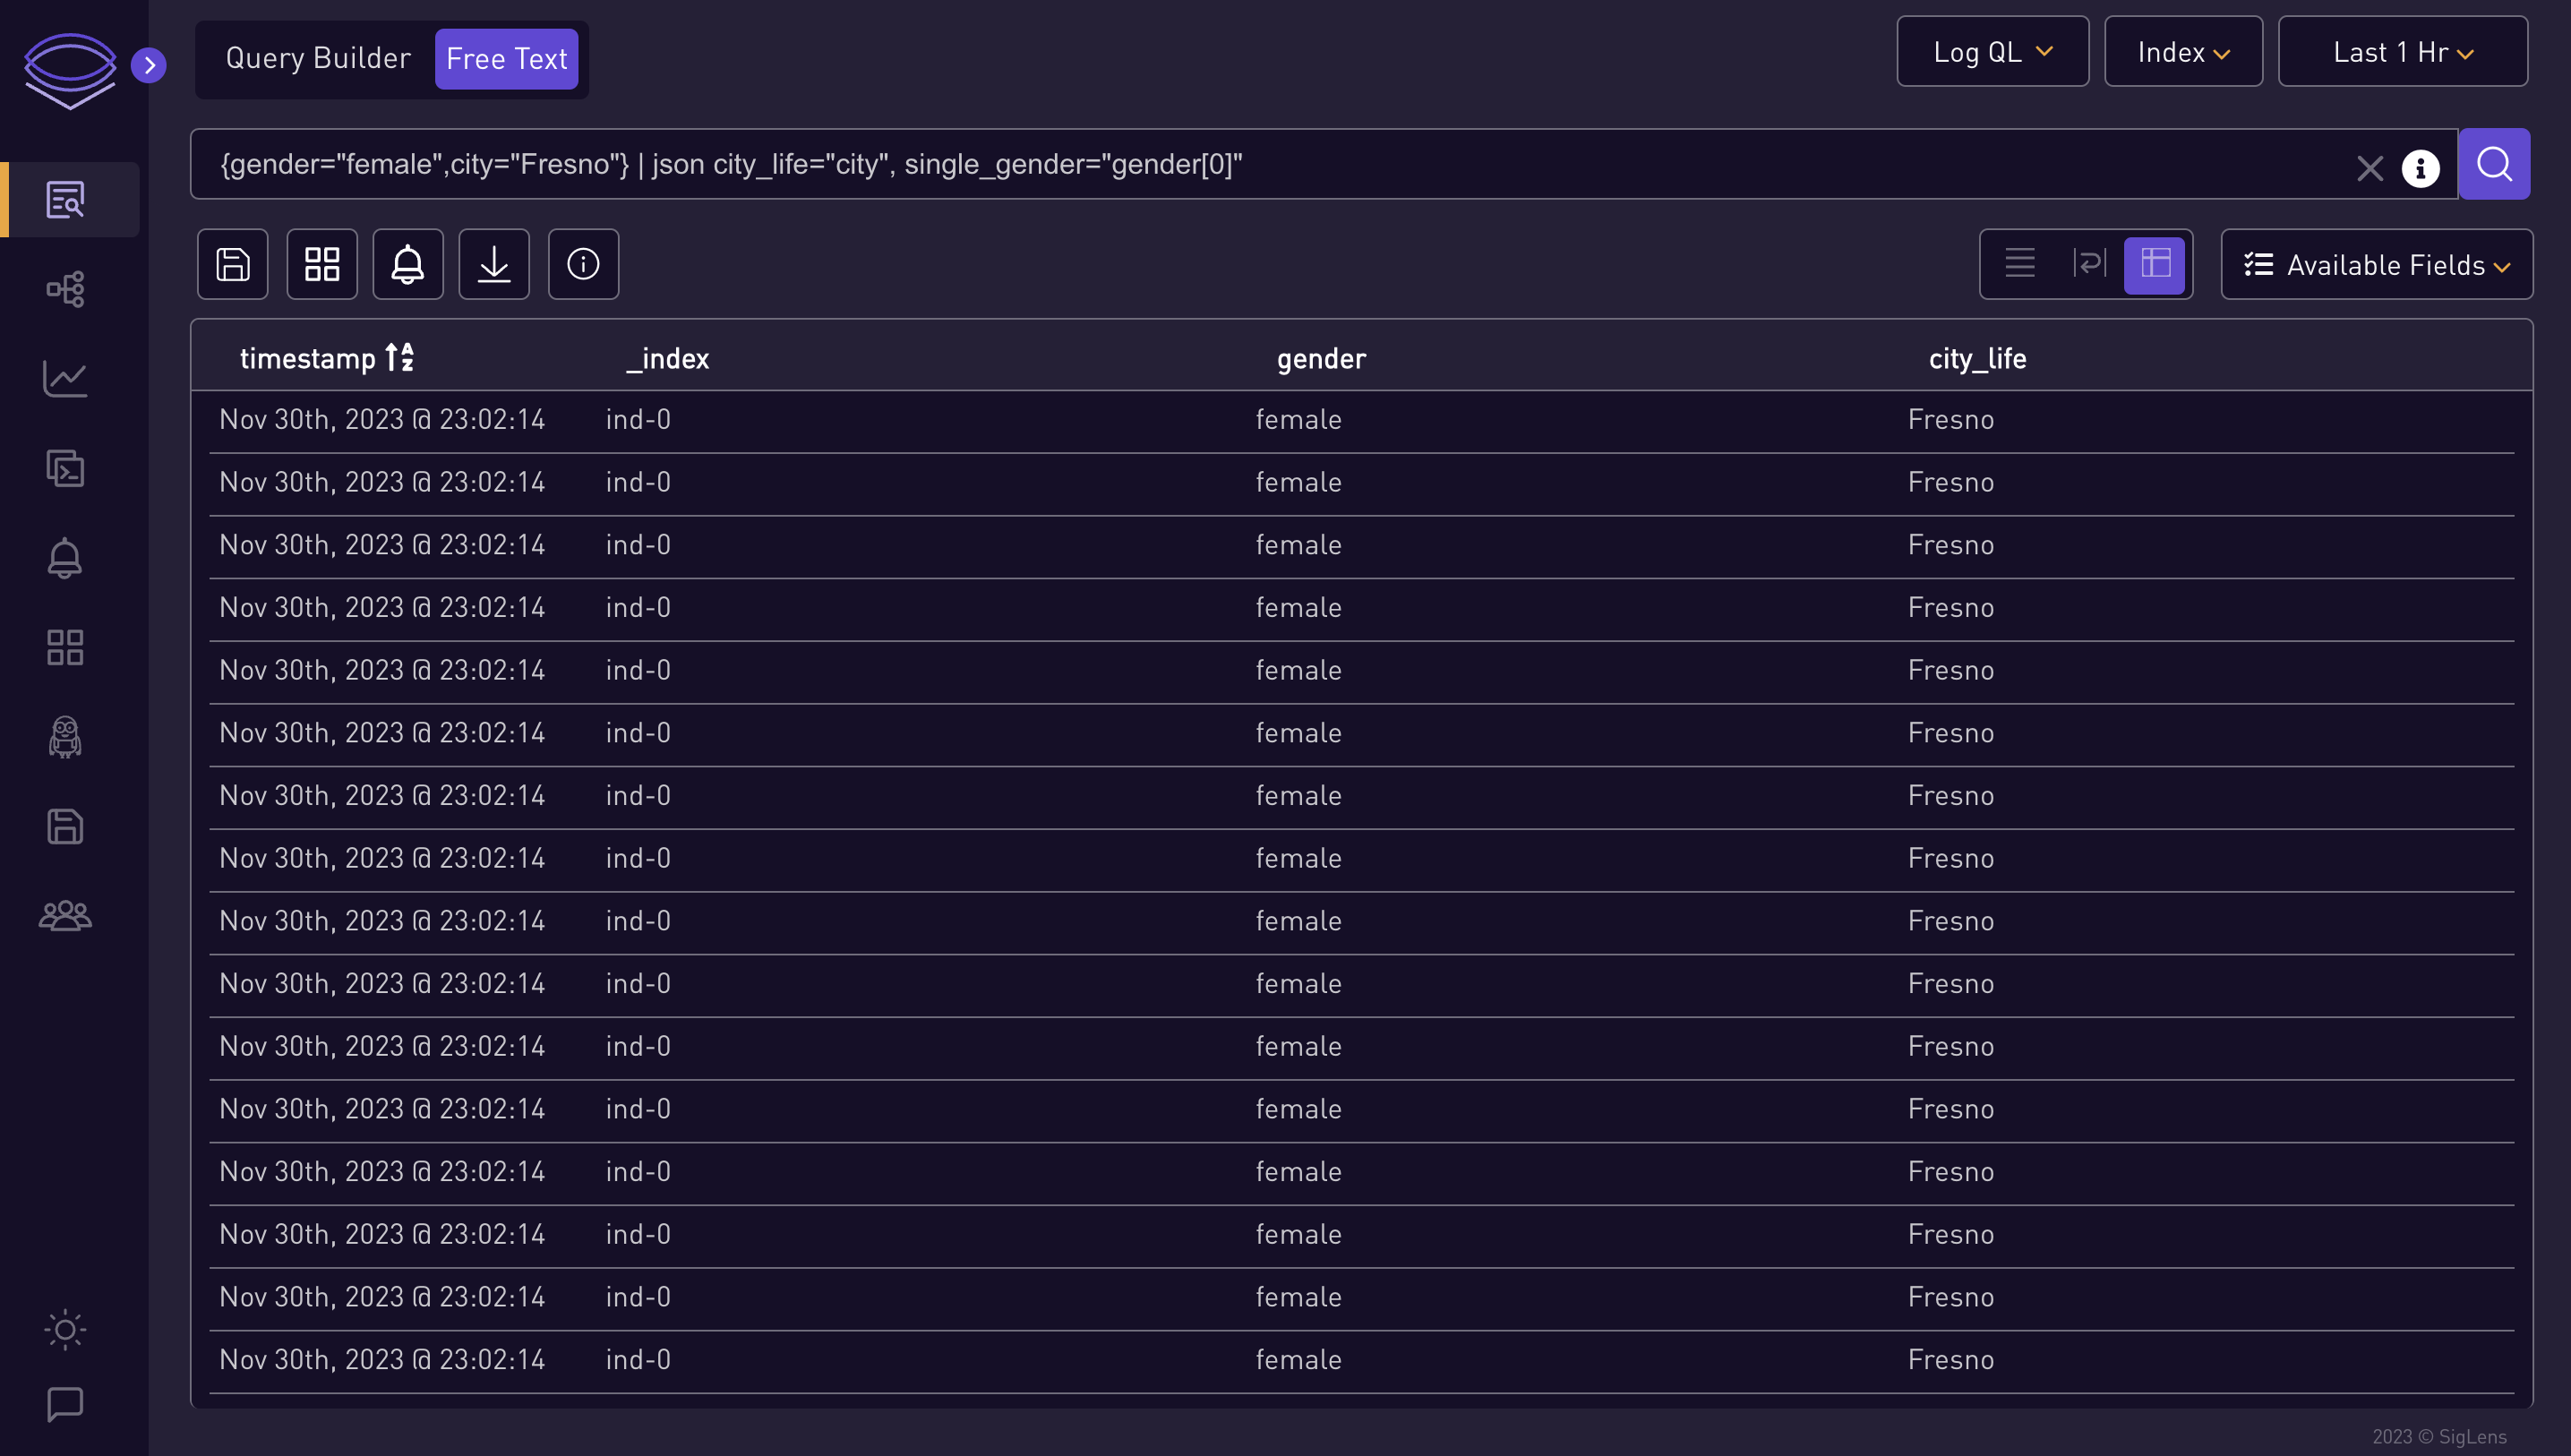
{gender="female",city="Fresno"} | logfmt city_life="city", single_gender="gender", host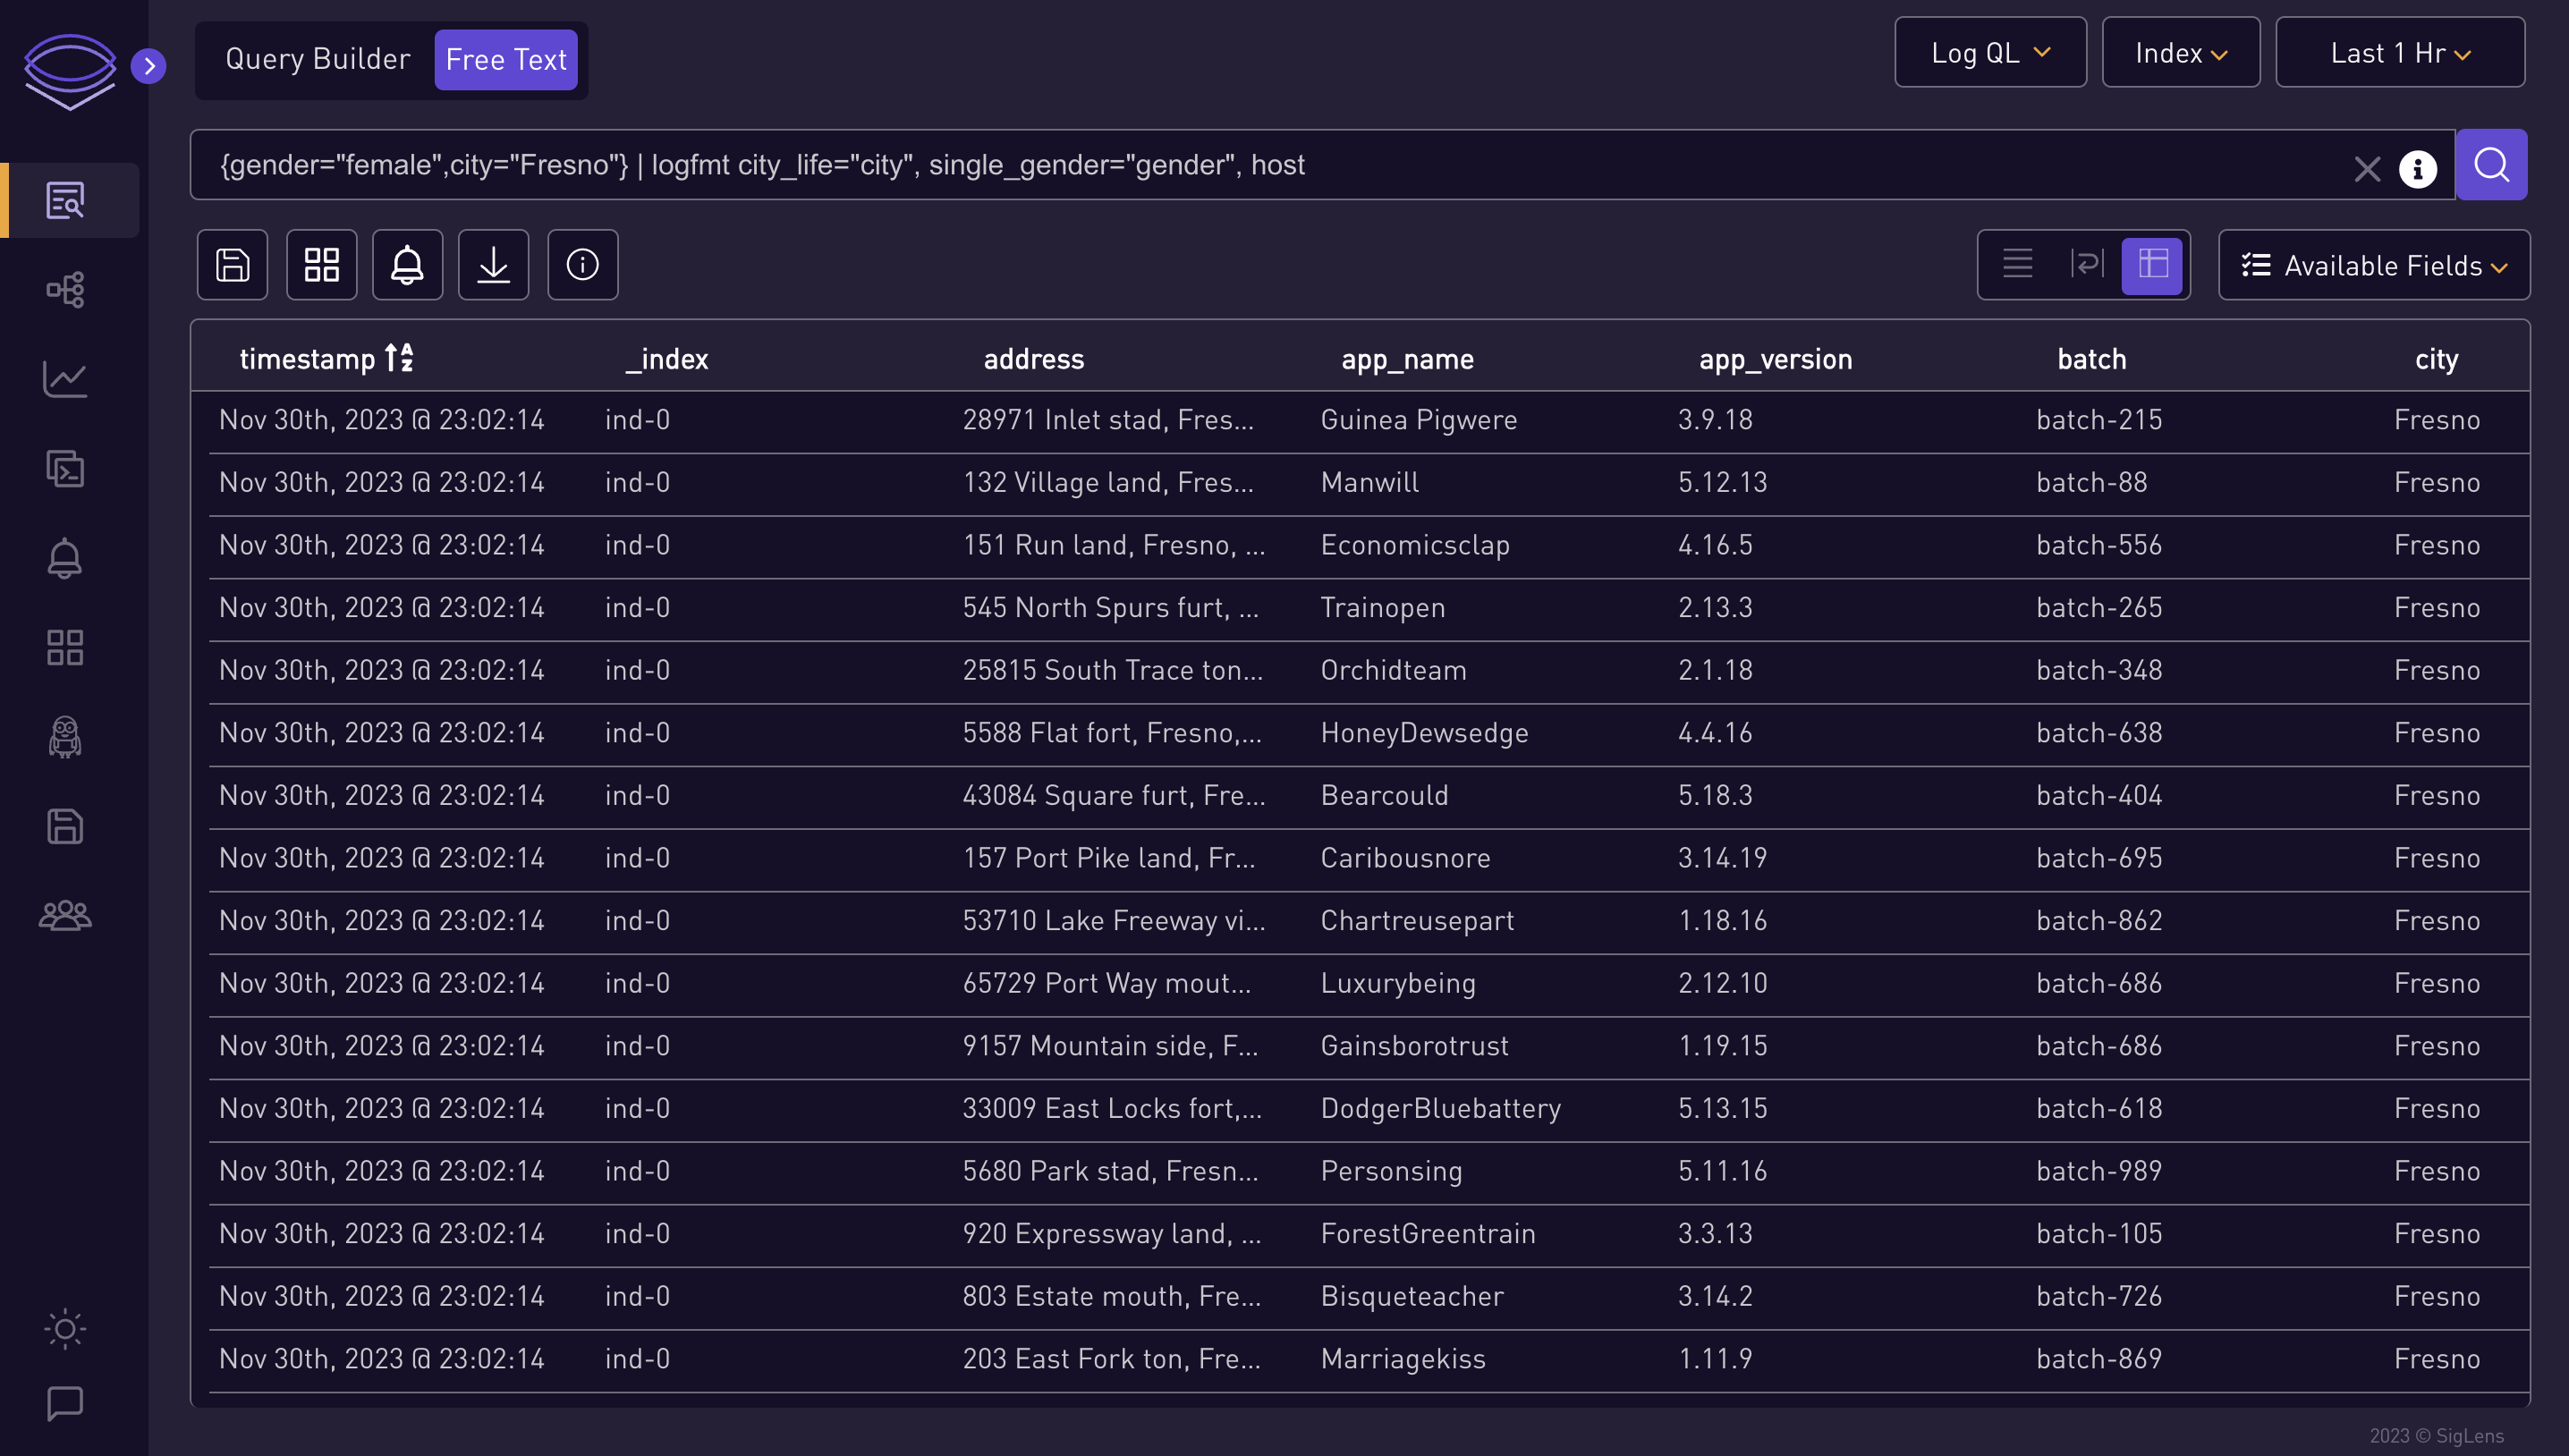
-